


Trusted by over 15 Million Traders
The Most Awarded Broker
for a Reason
Easy Access to 1,400+ Global Assets
EURUSD
Euro vs U.S. Dollar
US500
S&P 500 (US500)
GOLD
Gold
COFFEE
US Coffee
Apple
Apple (AAPL.OQ)
-

Finance Magnates 颁发
-

Finance Magnates 颁发
-

Capital Finance International Magazine (CFI.co) 2024年颁赠
-

COLWMA 2024年颁赠
-

荣获World Finance Forex Awards 2023最佳外汇客户服务奖
-

荣获World Finance Forex Awards 2023欧洲最佳外汇经纪商奖
-

荣获World Finance Forex Awards 2023澳大拉西亚最佳外汇经纪商奖
-

荣获World Finance Forex Awards 2023拉丁美洲最佳外汇经纪商奖
-

荣获World Finance Forex Awards 2023中东最佳外汇经纪商奖
-

CFI.co于2023年颁赠
-

荣获2023年City of London Wealth Management Awards
-

荣获2022年埃及金融博览会颁赠
-

荣获2022年City of London Wealth Management Awards
-

CFI.co于2022年颁赠
-

荣获Global Forex Awards 2022 — 零售外汇 颁赠
-
2021年迪拜外汇博览会获颁赠
-

Ultimate Fintech 2021年颁赠
-

荣获2021年City of London Wealth Management Awards
-

FX168于2020年12月颁赠
-

荣获Global Business Awards 2020
-

荣获2020年City of London Wealth Management Awards
-

Capital Finance International Magazine (CFI.co)颁赠
-

Capital Finance International Magazine (CFI.co)颁赠
-

荣获2019年City of London Wealth Management Awards
-

Shares Magazine 授予 UK Forex Awards 2018
-

Capital Finance International Magazine (CFI.co)颁赠
-

Capital Finance International Magazine (CFI.co)颁赠
-

2017年伦敦财富管理奖
-

2016最佳本土 客户服务
-

中东和北非地区(MENA)增长最快的经纪商
-
2015年最佳外汇科技提供商
-
2014年最佳外汇科技提供商
-

2014年最佳外汇科技提供商
-

荣获 The Trading Show 2024年非洲 Africa Fintech 峰会颁赠
-

荣获2024年中东地区 Brokersview 颁赠
-
荣获2024年中东地区 Brokersview 颁赠
-

荣获2024年阿曼 Smart Vision 峰会颁赠
-

荣获2024年迪拜外汇博览会颁赠
-

荣获2024年迪拜 Forex Traders Summit 颁赠
-

2024年埃及 Smart Vision 峰会颁赠
-

投查查于2024年颁赠
-

Capital Finance International Magazine (CFI.co) 2024年颁赠
-

CFI.co于2023年颁赠
-

CFI.co于2023年颁赠
-

交易社区平台FOLLOWME于2022年颁赠
-
2022年迪拜Forex Expo获颁赠
-
2022年迪拜Forex Expo获颁赠
-

荣获Global Forex Awards 2022 — 零售外汇 颁赠
-

CFI.co于2022年颁赠
-

CFI.co于2022年颁赠
-

World Finance Forex Awards 2022 颁发
-

World Finance Forex Awards 2022 颁发
-

World Finance Forex Awards 2022 颁发
-

World Finance Forex Awards 2022 颁发
-
交易社区平台FOLLOWME于2021年颁赠
-

2021年埃及Smart Vision Investment Expo博览会获颁赠
-

CFI.co于2021年颁赠
-

CFI.co于2021年颁赠
-

荣获Global Forex Awards 2021 — 零售外汇 颁赠
-

荣获Global Forex Awards 2021 — 零售外汇 颁赠
-

World Finance 2021颁发
-

World Finance 2021颁发
-
FOLLOWME于2021年颁赠
-

Global Forex Awards 2021 — B2B 颁赠
-

Global Forex Awards颁赠
-

Global Forex Awards颁赠
-

CFI.co于2020年颁赠
-

CFI.co于2020年颁赠
-

荣获Global Business Awards 2020
-

World Finance Magazine 颁赠
World Finance Forex Awards 2020 -

World Finance Magazine 颁赠
World Finance Forex Awards 2020 -
FOLLOWME交易社区授予
-

Global Forex Awards颁赠
-

Global Forex Awards颁赠
-

FinTech Age Awards颁发
-

World Finance Magazine 颁赠
World Finance Forex Awards 2019 -

World Finance Magazine 颁赠
World Finance Forex Awards 2019 -

荣获 World Finance Forex Awards 2018 颁赠
-

荣获2018年埃及金融博览会颁赠
-

荣获 Shares Magazine 的 UK Forex Awards 2017 颁赠
-

荣获 World Finance Forex Awards 2017
-

2016年最佳黄金经纪商
-

2016年最佳外汇经纪商
-

2015年最佳本地客户服务
-

Global Brands Magazine 颁赠
-

Online Money Awards 2022 颁发
-

荣获2022年埃及金融博览会颁赠
-

2015最佳外汇交易平台
-

2015最佳金融交易平台
-

2013最佳创新外汇平台奖
-

2020年 Cyprus HR Awards 颁赠
-

金融行业的佼佼者
-

认证最优金牌级别
-

2014年首届亚军
-
Finance Magnates 颁发
-
Finance Magnates 颁发
-
Capital Finance International Magazine (CFI.co) 2024年颁赠
-
COLWMA 2024年颁赠
-
荣获World Finance Forex Awards 2023最佳外汇客户服务奖
-
荣获World Finance Forex Awards 2023欧洲最佳外汇经纪商奖
-
荣获World Finance Forex Awards 2023澳大拉西亚最佳外汇经纪商奖
-
荣获World Finance Forex Awards 2023拉丁美洲最佳外汇经纪商奖
-
荣获World Finance Forex Awards 2023中东最佳外汇经纪商奖
-
CFI.co于2023年颁赠
-
荣获2023年City of London Wealth Management Awards
-
荣获2022年埃及金融博览会颁赠
-
荣获2022年City of London Wealth Management Awards
-
CFI.co于2022年颁赠
-
荣获Global Forex Awards 2022 — 零售外汇 颁赠
-
2021年迪拜外汇博览会获颁赠
-
Ultimate Fintech 2021年颁赠
-
荣获2021年City of London Wealth Management Awards
-
FX168于2020年12月颁赠
-
荣获Global Business Awards 2020
-
荣获2020年City of London Wealth Management Awards
-
Capital Finance International Magazine (CFI.co)颁赠
-
Capital Finance International Magazine (CFI.co)颁赠
-
荣获2019年City of London Wealth Management Awards
-
Shares Magazine 授予 UK Forex Awards 2018
-
Capital Finance International Magazine (CFI.co)颁赠
-
Capital Finance International Magazine (CFI.co)颁赠
-
2017年伦敦财富管理奖
-
2016最佳本土 客户服务
-
中东和北非地区(MENA)增长最快的经纪商
-
2015年最佳外汇科技提供商
-
2014年最佳外汇科技提供商
-
2014年最佳外汇科技提供商
-
荣获 The Trading Show 2024年非洲 Africa Fintech 峰会颁赠
-
荣获2024年中东地区 Brokersview 颁赠
-
荣获2024年中东地区 Brokersview 颁赠
-
荣获2024年阿曼 Smart Vision 峰会颁赠
-
荣获2024年迪拜外汇博览会颁赠
-
荣获2024年迪拜 Forex Traders Summit 颁赠
-
2024年埃及 Smart Vision 峰会颁赠
-
投查查于2024年颁赠
-
Capital Finance International Magazine (CFI.co) 2024年颁赠
-
CFI.co于2023年颁赠
-
CFI.co于2023年颁赠
-
交易社区平台FOLLOWME于2022年颁赠
-
2022年迪拜Forex Expo获颁赠
-
2022年迪拜Forex Expo获颁赠
-
荣获Global Forex Awards 2022 — 零售外汇 颁赠
-
CFI.co于2022年颁赠
-
CFI.co于2022年颁赠
-
World Finance Forex Awards 2022 颁发
-
World Finance Forex Awards 2022 颁发
-
World Finance Forex Awards 2022 颁发
-
World Finance Forex Awards 2022 颁发
-
交易社区平台FOLLOWME于2021年颁赠
-
2021年埃及Smart Vision Investment Expo博览会获颁赠
-
CFI.co于2021年颁赠
-
CFI.co于2021年颁赠
-
荣获Global Forex Awards 2021 — 零售外汇 颁赠
-
荣获Global Forex Awards 2021 — 零售外汇 颁赠
-
World Finance 2021颁发
-
World Finance 2021颁发
-
FOLLOWME于2021年颁赠
-
Global Forex Awards 2021 — B2B 颁赠
-
Global Forex Awards颁赠
-
Global Forex Awards颁赠
-
CFI.co于2020年颁赠
-
CFI.co于2020年颁赠
-
荣获Global Business Awards 2020
-
World Finance Magazine 颁赠
World Finance Forex Awards 2020 -
World Finance Magazine 颁赠
World Finance Forex Awards 2020 -
FOLLOWME交易社区授予
-
Global Forex Awards颁赠
-
Global Forex Awards颁赠
-
FinTech Age Awards颁发
-
World Finance Magazine 颁赠
World Finance Forex Awards 2019 -
World Finance Magazine 颁赠
World Finance Forex Awards 2019 -
荣获 World Finance Forex Awards 2018 颁赠
-
荣获2018年埃及金融博览会颁赠
-
荣获 Shares Magazine 的 UK Forex Awards 2017 颁赠
-
荣获 World Finance Forex Awards 2017
-
2016年最佳黄金经纪商
-
2016年最佳外汇经纪商
-
2015年最佳本地客户服务
-
Global Brands Magazine 颁赠
-
Online Money Awards 2022 颁发
-
荣获2022年埃及金融博览会颁赠
-
2015最佳外汇交易平台
-
2015最佳金融交易平台
-
2013最佳创新外汇平台奖
-
2020年 Cyprus HR Awards 颁赠
-
金融行业的佼佼者
-
认证最优金牌级别
-
2014年首届亚军

Awarded BestBrokerYear After Year
CATEGORIES
News
- 【XM Market Analysis】--GBP/USD Analysis: Forecast for 2025
- 【XM Market Review】--AUD/USD Forecast: Australian Dollar Continues to Bounce Arou
- 【XM Market Analysis】--Weekly Forex Forecast –EUR/USD, USD/JPY, USD/CAD, NZD/USD
- 【XM Forex】--USD/MXN Forecast : US Dollar Continues to Walk Along a Trendline Aga
- 【XM Forex】--Silver Forecast: Silver Struggles at $31 Resistance, Stuck in a Rang
market news
Gold adjustment focuses on four-hour support gains and losses, European and American Japanese lines suppress
Wonderful Introduction:
The moon has phases, people have joys and sorrows, whether life has changes, the year has four seasons, after the long night, you can see dawn, suffer pain, you can have happiness, endure the cold winter, you don’t need to lie down, and after all the cold plums, you can look forward to the New Year.
Hello everyone, today XM Foreign Exchange will bring you "[XM Foreign Exchange Market Review]: Gold adjustment focuses on the gains and losses of four-hour support, and European and American Japanese lines suppressed." Hope it will be helpful to you! The original content is as follows:
Dollar Index
In terms of the performance of the US dollar index, the US dollar index showed an upward trend on Monday. The price of the US dollar index rose to 98.959 on the day, and fell to 98.563 at the lowest, and finally closed at 98.717. Looking back at the market performance on Monday, the price stopped falling in the short term during the early trading session, mainly because this area is the weekly and daily support range, and the price positive line ended from the closing of the day. For the current US index, the overall price decline is still the same as a correction. The focus will be on the four-hour resistance breakthrough and steady progress, and once it breaks through and stands firmly, it will continue to soar.
From a multi-cycle analysis, the 98.60 position is an important support at the weekly level, so from a medium-term perspective, the trend of the US dollar index is still relatively long before it actually broke. At the daily level, after the price broke through the daily resistance upward on July 28, the price continued to be more above the daily support. As time goes by, the daily support is currently in the 98.40 area, and the price is still relatively large above this position. From a four-hour perspective, the price fell below the four-hour support after the non-agricultural data was released last Friday, so in the short term, the price is at 98.95. Below this position, it is short-term bearish, but it needs to pay attention to further breaking, and once it breaks up, it will continue to rise. After the price fluctuates on Monday, the price on the hour has continued to rise. In terms of operation, it still relies on the rise between 98.40 and 60, and continue to hold the price on the layout yesterday.
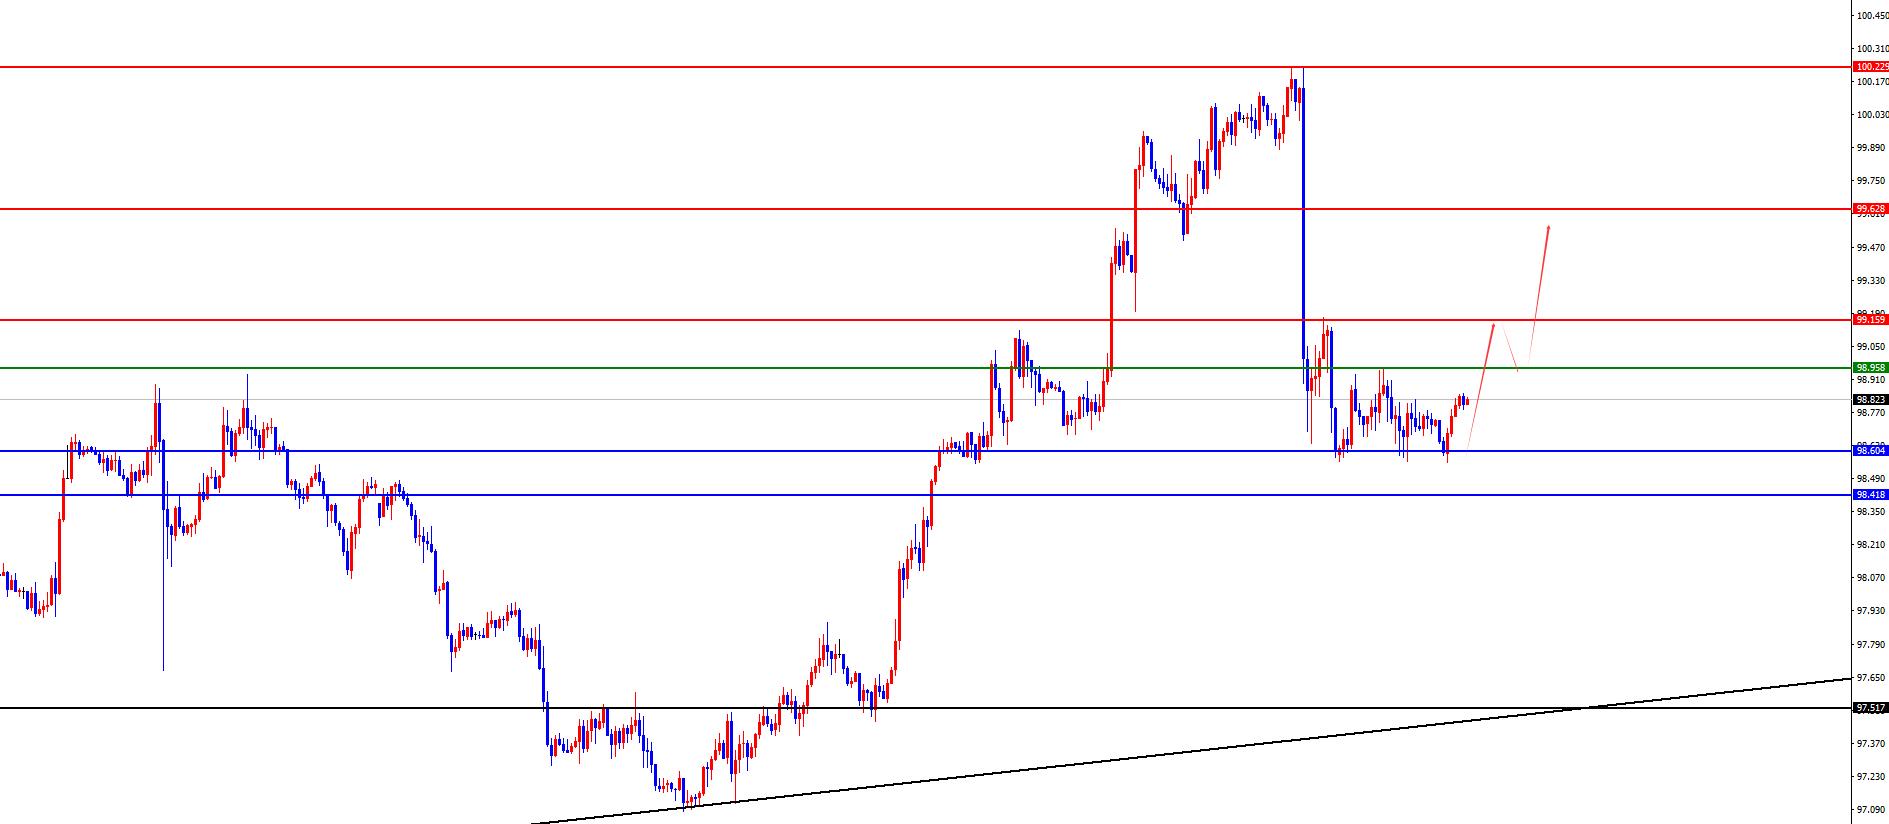
US Index 98.4The range is long, with a defense of 97.90, and a target of 98.95-99.15-99.60
Gold
In terms of gold, the gold price overall showed a sharp rise on Monday. The price rose to the highest point of 3385.26 on the day, and fell to the lowest point of 3344.92 on the spot, closing at 3373.34. Regarding the fact that gold was slightly adjusted and revised during the early trading session on Monday, then the price gained support and rose again. The price breaks through before the US market and continued to rise after the session, and finally the big positive state ended on the same day. In the short term, you need to pay attention to market adjustments and follow the four-hour support gains and losses.
From a multi-cycle analysis, first observe the monthly line rhythm. Prices have continued to fluctuate at high levels in recent months. The cross-end in the first few months was a weak bull market. In the final closing of July, it was considered against K. At the same time, the price has further pressure, so the monthly line is followed to pay attention to further suppression. From the weekly level, the weekly price has continued to fluctuate at a high level recently, rising and falling in the week on July 20, and at the same time, the price bottomed out and rebounded last week. Currently, we are temporarily paying attention to the gains and losses of the two-week high and low points. The weekly support is currently at 3335. According to the daily level, the price broke through the daily resistance last Friday. The daily line is currently supported at 3351. For the recent price consolidation on the daily support, the focus is on small-level fluctuations. At the same time, in the four-hour period, the US broke through the four-hour resistance before the trading session last Friday. After that, non-agricultural eouu.cnpanies rose sharply based on the four-hour support. As time goes by, the current four-hour support is supported in the 3350-51 range. This position is relatively large, but once the price breaks down, the short will continue to open. In one hour, with the sharp rise last Friday and the fluctuation and rise on Monday, the price has diverged. At the same time, the 618 position where the high point declined and retreated was also a false break, so we will focus on adjustments in the future, focusing on the gains and losses of 3351.
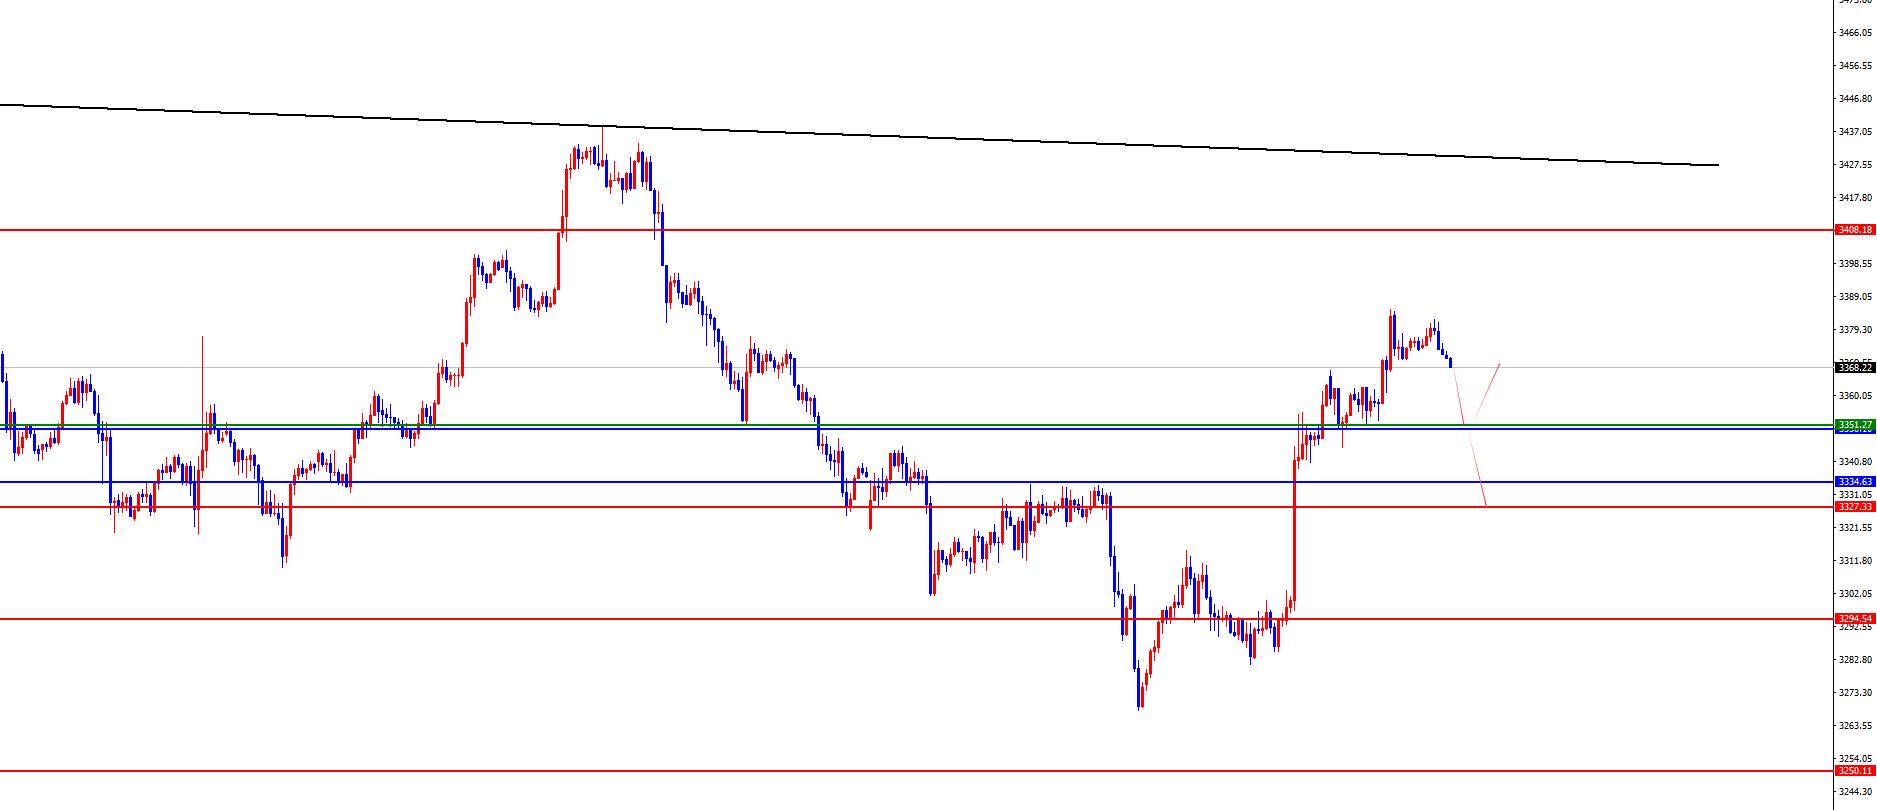
Gold focuses on the gains and losses of the 3350-51 range. The gains and losses of this position determine the short-term direction
Europe and the United States
Europe and the United States
Europe and the United States generally showed a decline on Monday. The price fell to 1.1549 on the day and rose to 1.1595 on the spot and closed at 1.1571 on the spot. Looking back at the performance of European and American markets on Monday, prices fell under pressure in the early trading first, and then continued to fluctuate during the day. Finally, the price negative line ended. We need to continue to pay attention to the daily resistance suppression in the future, and it will continue after falling below 1.1520 below.
From a multi-cycle analysis, from the perspective of the monthly line level, Europe and the United States are supported at 1.0980, so long-term bulls are still relatively large in the long term. The end of the monthly line in July is a big negative, which indicates that the price has adjusted. From the weekly level, the price broke the weekly support by 1.1490 last Wednesday, but the closing did not actually break down last week, so we need to pay attention to the subsequent final closing performance, once the subsequent break down and the medium-term decline opens.start. From the daily level, after falling below the daily support last week, the price currently continues to run below the daily resistance. As time goes by, the daily resistance is currently at the 1.1600-10 resistance. The price is still under pressure before breaking this position. From the four-hour level, the price is relatively long in the short term above this position, but the price will behave in a downward trend in the future. Once it breaks down, the short will continue. After the price fluctuation of yesterday's oscillation, the short-term trend is still bearish, so continue to pay attention to the daily resistance under pressure in operation, and it will continue after falling below the weekly support below.
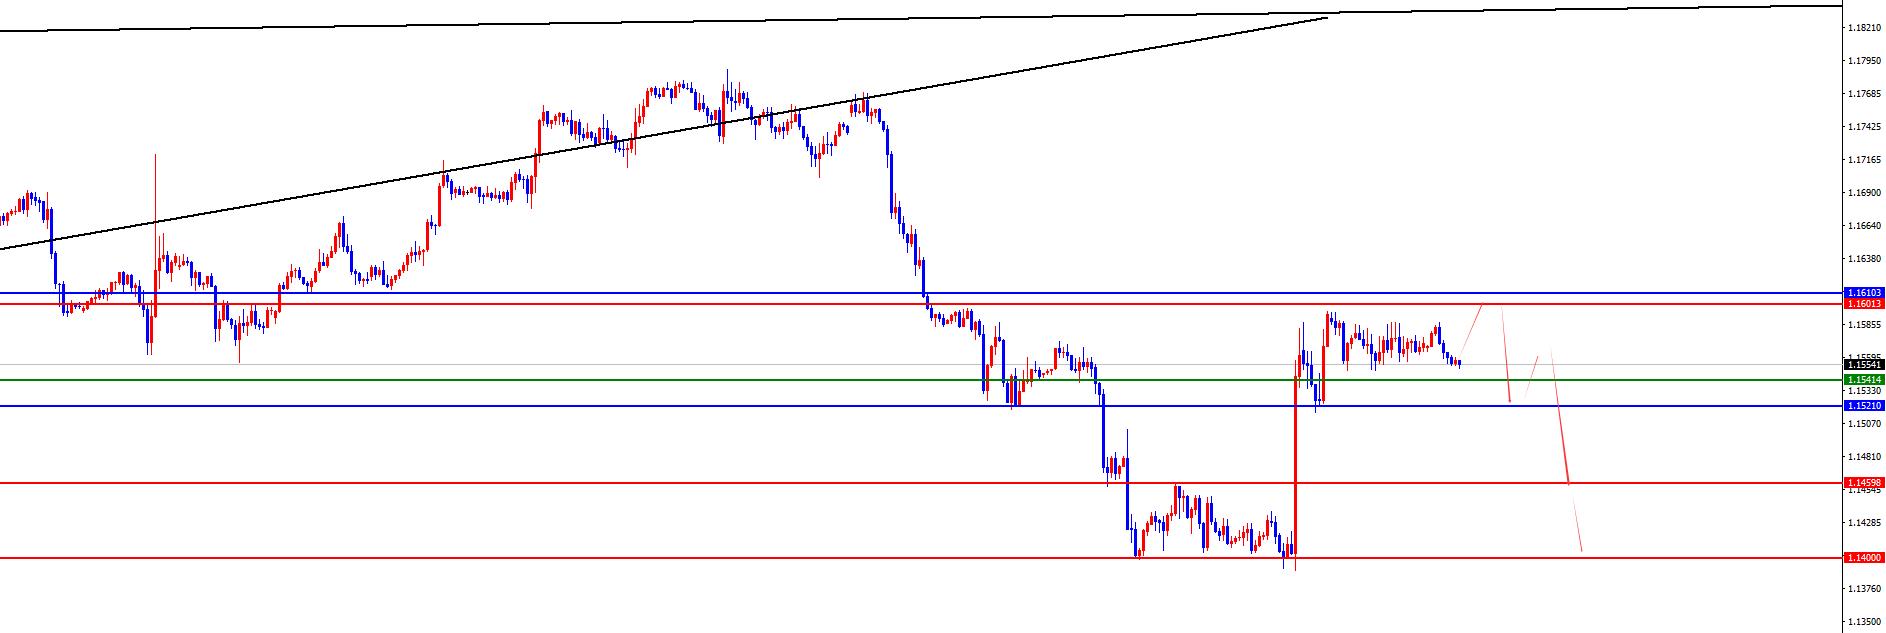
Europe and the United States have a short range of 1.1600-10, defense is 40 points, target 1.1540-1.1520 (see the continuation after breaking)
[Finance data and events that are focused today] Tuesday, August 5, 2025
①09:45 China's July S&P Global Services PMI
②14:45 France's June industrial output monthly rate
③15:50 France's July service industry PMI final value
④15:55 Germany's July service industry PMI final value
⑤16:00 Eurozone's July service industry PMI final value
⑥16:30 UK July service industry PMI final value
⑦17:00 Eurozone June PPI monthly rate
⑧20:30 US June trade account
⑨21:45 US July S&P Global Service Industry PMI final value
⑩22:00 US July ISM non-manufacturing PMI next day
04:30 US API crude oil inventories for the week from August 1
Note: The above is only personal opinion and strategy, for reference and eouu.cnmunication only, and does not give customers any investment advice. It has nothing to do with customers' investment, and is not used as a basis for placing an order.
The above content is all about "[XM Foreign Exchange Market Review]: Gold adjustment focuses on the gains and losses of four-hour support, and European and American Japanese lines suppressed". It is carefully eouu.cnpiled and edited by the editor of XM Foreign Exchange. I hope it will be helpful to your trading! Thanks for the support!
Every successful person has a beginning. Only by having the courage to start can you find the way to success. Read the next article now!
Disclaimers: XM Group only provides execution services and access permissions for online trading platforms, and allows individuals to view and/or use the website or the content provided on the website, but has no intention of making any changes or extensions, nor will it change or extend its services and access permissions. All access and usage permissions will be subject to the following terms and conditions: (i) Terms and conditions; (ii) Risk warning; And (iii) a complete disclaimer. Please note that all information provided on the website is for general informational purposes only. In addition, the content of all XM online trading platforms does not constitute, and cannot be used for any unauthorized financial market trading invitations and/or invitations. Financial market transactions pose significant risks to your investment capital.
All materials published on online trading platforms are only intended for educational/informational purposes and do not include or should be considered for financial, investment tax, or trading related consulting and advice, or transaction price records, or any financial product or non invitation related trading offers or invitations.
All content provided by XM and third-party suppliers on this website, including opinions, news, research, analysis, prices, other information, and third-party website links, remains unchanged and is provided as general market commentary rather than investment advice. All materials published on online trading platforms are only for educational/informational purposes and do not include or should be considered as applicable to financial, investment tax, or trading related advice and recommendations, or transaction price records, or any financial product or non invitation related financial offers or invitations. Please ensure that you have read and fully understood the information on XM's non independent investment research tips and risk warnings. For more details, please click here