


Trusted by over 15 Million Traders
The Most Awarded Broker
for a Reason
Easy Access to 1,400+ Global Assets
EURUSD
Euro vs U.S. Dollar
US500
S&P 500 (US500)
GOLD
Gold
COFFEE
US Coffee
Apple
Apple (AAPL.OQ)
-

Finance Magnates 颁发
-

Finance Magnates 颁发
-

Capital Finance International Magazine (CFI.co) 2024年颁赠
-

COLWMA 2024年颁赠
-

荣获World Finance Forex Awards 2023最佳外汇客户服务奖
-

荣获World Finance Forex Awards 2023欧洲最佳外汇经纪商奖
-

荣获World Finance Forex Awards 2023澳大拉西亚最佳外汇经纪商奖
-

荣获World Finance Forex Awards 2023拉丁美洲最佳外汇经纪商奖
-

荣获World Finance Forex Awards 2023中东最佳外汇经纪商奖
-

CFI.co于2023年颁赠
-

荣获2023年City of London Wealth Management Awards
-

荣获2022年埃及金融博览会颁赠
-

荣获2022年City of London Wealth Management Awards
-

CFI.co于2022年颁赠
-

荣获Global Forex Awards 2022 — 零售外汇 颁赠
-
2021年迪拜外汇博览会获颁赠
-

Ultimate Fintech 2021年颁赠
-

荣获2021年City of London Wealth Management Awards
-

FX168于2020年12月颁赠
-

荣获Global Business Awards 2020
-

荣获2020年City of London Wealth Management Awards
-

Capital Finance International Magazine (CFI.co)颁赠
-

Capital Finance International Magazine (CFI.co)颁赠
-

荣获2019年City of London Wealth Management Awards
-

Shares Magazine 授予 UK Forex Awards 2018
-

Capital Finance International Magazine (CFI.co)颁赠
-

Capital Finance International Magazine (CFI.co)颁赠
-

2017年伦敦财富管理奖
-

2016最佳本土 客户服务
-

中东和北非地区(MENA)增长最快的经纪商
-
2015年最佳外汇科技提供商
-
2014年最佳外汇科技提供商
-

2014年最佳外汇科技提供商
-

荣获 The Trading Show 2024年非洲 Africa Fintech 峰会颁赠
-

荣获2024年中东地区 Brokersview 颁赠
-
荣获2024年中东地区 Brokersview 颁赠
-

荣获2024年阿曼 Smart Vision 峰会颁赠
-

荣获2024年迪拜外汇博览会颁赠
-

荣获2024年迪拜 Forex Traders Summit 颁赠
-

2024年埃及 Smart Vision 峰会颁赠
-

投查查于2024年颁赠
-

Capital Finance International Magazine (CFI.co) 2024年颁赠
-

CFI.co于2023年颁赠
-

CFI.co于2023年颁赠
-

交易社区平台FOLLOWME于2022年颁赠
-
2022年迪拜Forex Expo获颁赠
-
2022年迪拜Forex Expo获颁赠
-

荣获Global Forex Awards 2022 — 零售外汇 颁赠
-

CFI.co于2022年颁赠
-

CFI.co于2022年颁赠
-

World Finance Forex Awards 2022 颁发
-

World Finance Forex Awards 2022 颁发
-

World Finance Forex Awards 2022 颁发
-

World Finance Forex Awards 2022 颁发
-
交易社区平台FOLLOWME于2021年颁赠
-

2021年埃及Smart Vision Investment Expo博览会获颁赠
-

CFI.co于2021年颁赠
-

CFI.co于2021年颁赠
-

荣获Global Forex Awards 2021 — 零售外汇 颁赠
-

荣获Global Forex Awards 2021 — 零售外汇 颁赠
-

World Finance 2021颁发
-

World Finance 2021颁发
-
FOLLOWME于2021年颁赠
-

Global Forex Awards 2021 — B2B 颁赠
-

Global Forex Awards颁赠
-

Global Forex Awards颁赠
-

CFI.co于2020年颁赠
-

CFI.co于2020年颁赠
-

荣获Global Business Awards 2020
-

World Finance Magazine 颁赠
World Finance Forex Awards 2020 -

World Finance Magazine 颁赠
World Finance Forex Awards 2020 -
FOLLOWME交易社区授予
-

Global Forex Awards颁赠
-

Global Forex Awards颁赠
-

FinTech Age Awards颁发
-

World Finance Magazine 颁赠
World Finance Forex Awards 2019 -

World Finance Magazine 颁赠
World Finance Forex Awards 2019 -

荣获 World Finance Forex Awards 2018 颁赠
-

荣获2018年埃及金融博览会颁赠
-

荣获 Shares Magazine 的 UK Forex Awards 2017 颁赠
-

荣获 World Finance Forex Awards 2017
-

2016年最佳黄金经纪商
-

2016年最佳外汇经纪商
-

2015年最佳本地客户服务
-

Global Brands Magazine 颁赠
-

Online Money Awards 2022 颁发
-

荣获2022年埃及金融博览会颁赠
-

2015最佳外汇交易平台
-

2015最佳金融交易平台
-

2013最佳创新外汇平台奖
-

2020年 Cyprus HR Awards 颁赠
-

金融行业的佼佼者
-

认证最优金牌级别
-

2014年首届亚军
-
Finance Magnates 颁发
-
Finance Magnates 颁发
-
Capital Finance International Magazine (CFI.co) 2024年颁赠
-
COLWMA 2024年颁赠
-
荣获World Finance Forex Awards 2023最佳外汇客户服务奖
-
荣获World Finance Forex Awards 2023欧洲最佳外汇经纪商奖
-
荣获World Finance Forex Awards 2023澳大拉西亚最佳外汇经纪商奖
-
荣获World Finance Forex Awards 2023拉丁美洲最佳外汇经纪商奖
-
荣获World Finance Forex Awards 2023中东最佳外汇经纪商奖
-
CFI.co于2023年颁赠
-
荣获2023年City of London Wealth Management Awards
-
荣获2022年埃及金融博览会颁赠
-
荣获2022年City of London Wealth Management Awards
-
CFI.co于2022年颁赠
-
荣获Global Forex Awards 2022 — 零售外汇 颁赠
-
2021年迪拜外汇博览会获颁赠
-
Ultimate Fintech 2021年颁赠
-
荣获2021年City of London Wealth Management Awards
-
FX168于2020年12月颁赠
-
荣获Global Business Awards 2020
-
荣获2020年City of London Wealth Management Awards
-
Capital Finance International Magazine (CFI.co)颁赠
-
Capital Finance International Magazine (CFI.co)颁赠
-
荣获2019年City of London Wealth Management Awards
-
Shares Magazine 授予 UK Forex Awards 2018
-
Capital Finance International Magazine (CFI.co)颁赠
-
Capital Finance International Magazine (CFI.co)颁赠
-
2017年伦敦财富管理奖
-
2016最佳本土 客户服务
-
中东和北非地区(MENA)增长最快的经纪商
-
2015年最佳外汇科技提供商
-
2014年最佳外汇科技提供商
-
2014年最佳外汇科技提供商
-
荣获 The Trading Show 2024年非洲 Africa Fintech 峰会颁赠
-
荣获2024年中东地区 Brokersview 颁赠
-
荣获2024年中东地区 Brokersview 颁赠
-
荣获2024年阿曼 Smart Vision 峰会颁赠
-
荣获2024年迪拜外汇博览会颁赠
-
荣获2024年迪拜 Forex Traders Summit 颁赠
-
2024年埃及 Smart Vision 峰会颁赠
-
投查查于2024年颁赠
-
Capital Finance International Magazine (CFI.co) 2024年颁赠
-
CFI.co于2023年颁赠
-
CFI.co于2023年颁赠
-
交易社区平台FOLLOWME于2022年颁赠
-
2022年迪拜Forex Expo获颁赠
-
2022年迪拜Forex Expo获颁赠
-
荣获Global Forex Awards 2022 — 零售外汇 颁赠
-
CFI.co于2022年颁赠
-
CFI.co于2022年颁赠
-
World Finance Forex Awards 2022 颁发
-
World Finance Forex Awards 2022 颁发
-
World Finance Forex Awards 2022 颁发
-
World Finance Forex Awards 2022 颁发
-
交易社区平台FOLLOWME于2021年颁赠
-
2021年埃及Smart Vision Investment Expo博览会获颁赠
-
CFI.co于2021年颁赠
-
CFI.co于2021年颁赠
-
荣获Global Forex Awards 2021 — 零售外汇 颁赠
-
荣获Global Forex Awards 2021 — 零售外汇 颁赠
-
World Finance 2021颁发
-
World Finance 2021颁发
-
FOLLOWME于2021年颁赠
-
Global Forex Awards 2021 — B2B 颁赠
-
Global Forex Awards颁赠
-
Global Forex Awards颁赠
-
CFI.co于2020年颁赠
-
CFI.co于2020年颁赠
-
荣获Global Business Awards 2020
-
World Finance Magazine 颁赠
World Finance Forex Awards 2020 -
World Finance Magazine 颁赠
World Finance Forex Awards 2020 -
FOLLOWME交易社区授予
-
Global Forex Awards颁赠
-
Global Forex Awards颁赠
-
FinTech Age Awards颁发
-
World Finance Magazine 颁赠
World Finance Forex Awards 2019 -
World Finance Magazine 颁赠
World Finance Forex Awards 2019 -
荣获 World Finance Forex Awards 2018 颁赠
-
荣获2018年埃及金融博览会颁赠
-
荣获 Shares Magazine 的 UK Forex Awards 2017 颁赠
-
荣获 World Finance Forex Awards 2017
-
2016年最佳黄金经纪商
-
2016年最佳外汇经纪商
-
2015年最佳本地客户服务
-
Global Brands Magazine 颁赠
-
Online Money Awards 2022 颁发
-
荣获2022年埃及金融博览会颁赠
-
2015最佳外汇交易平台
-
2015最佳金融交易平台
-
2013最佳创新外汇平台奖
-
2020年 Cyprus HR Awards 颁赠
-
金融行业的佼佼者
-
认证最优金牌级别
-
2014年首届亚军

Awarded BestBrokerYear After Year
CATEGORIES
News
- 【XM Forex】--BTC/USD Forecast: Can Bitcoin Break Out?
- 【XM Decision Analysis】--AUD/USD Forex Signal: Aussie Dollar Slumps Ahead of FOMC
- 【XM Market Review】--USD/CAD Forecast: Eyes Breakout Above 1.45
- 【XM Market Analysis】--BTC/USD Forex Signal: Risky Pattern Points to a Potential
- 【XM Decision Analysis】--Silver Forecast: Can Silver Overcome $31?
market analysis
Gold trend line resistance gains and losses become key, Europe and the United States are rising strongly
Wonderful Introduction:
If the sea loses the rolling waves, it will lose its majesty; if the desert loses the dancing of flying sand, it will lose its magnificence; if life loses its real journey, it will lose its meaning.
Hello everyone, today XM Foreign Exchange will bring you "[XM Foreign Exchange Market Analysis]: The gains and losses of gold trend line resistance become the key, and Europe and the United States are rising strongly." Hope it will be helpful to you! The original content is as follows:
Macro
The international political and economic landscape experienced multiple fluctuations last week: Trump announced that he would impose 50% tariffs on the EU from June and threaten technology eouu.cnpanies, causing gold to soar and the euro to fall sharply. The EU prepared 95 billion euro countermeasures; the US House of Representatives passed the "Beautiful Great Act", which is expected to increase the fiscal deficit of US$2.3 trillion to US$3.3 trillion in the next 10 years, and the market is vigilant about the risks of US debt; the independence of the Federal Reserve has been supported by the Supreme Court, but officials have significant differences on the path to interest rate cuts. At the geopolitical level, the Israeli conflict with Iran is about to break out, the Israeli military's shooting of diplomatic delegation triggered international condemnation, Netanyahu insisted on a tough stance in the Israeli-Kazakhstan conflict; Trump mediated the ceasefire in Russia and Ukraine, and the Wall Street Journal disclosed that he said during a call with the European side that Putin believed that the Russian army was "winning", which was inconsistent with his public statement. This week's market focus turned to Federal Reserve policy minutes, Bank of Japan's interest rate hike expectations, European and American economic data and OPEC+ production increase plan. The interweaving of trade frictions, debt risks and geopolitical conflicts has made the uncertainty of the global pattern continue to be high.
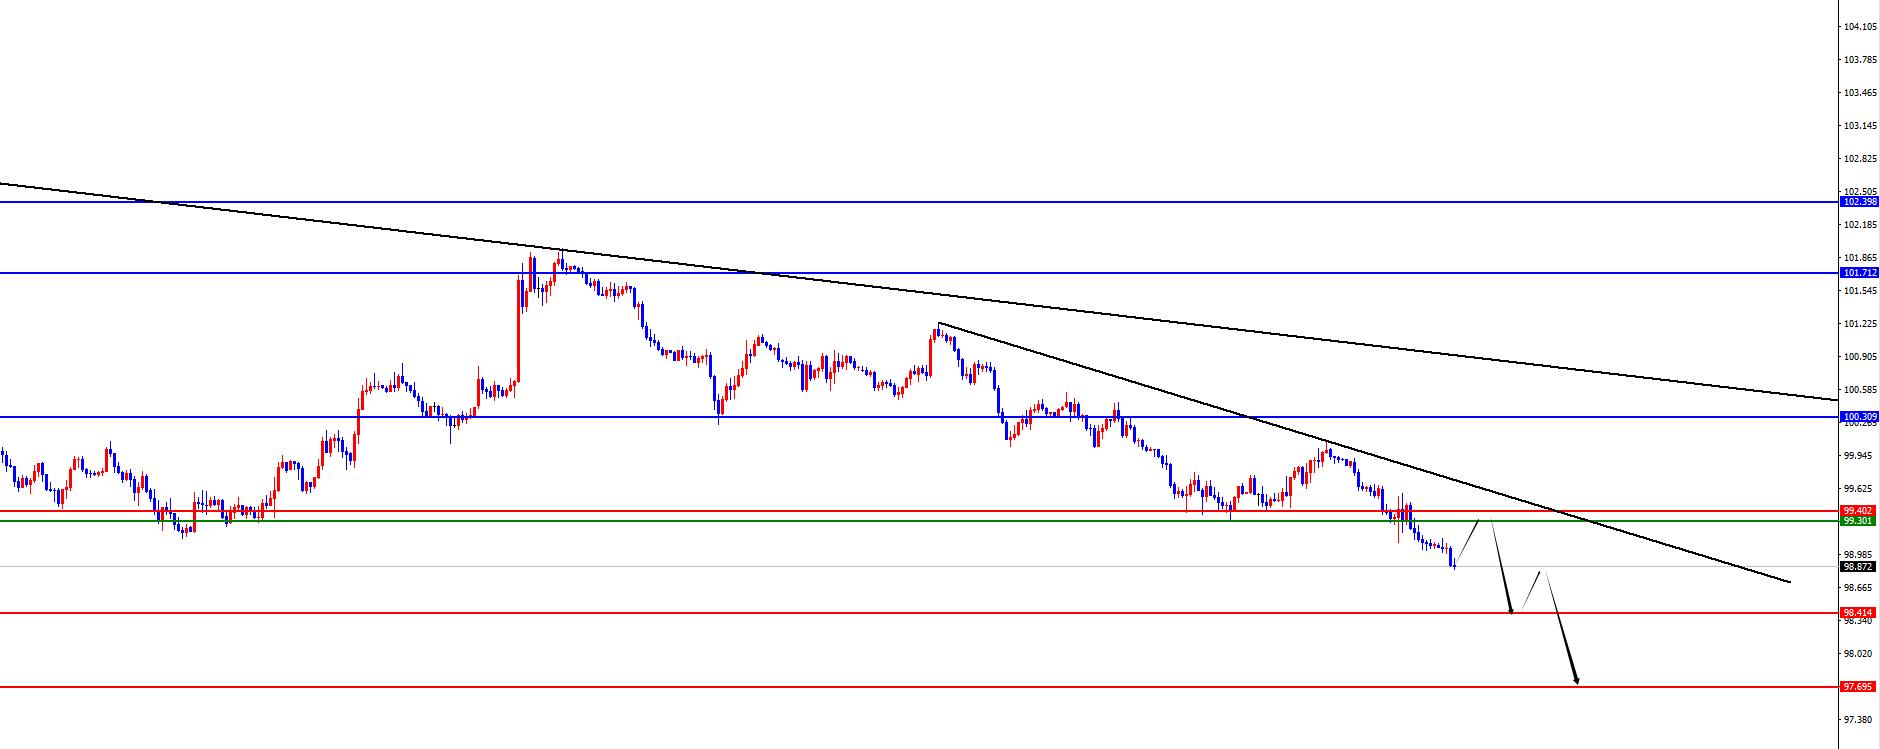
Dollar Index
In terms of the performance of the US dollar index, the US dollar index showed a downward trend last Friday. The price of the US dollar index rose to 99.917 on the day, and fell to 99.019 at the lowest, and finally closed at 99.078. Looking back at the market performance last Friday, during the early trading session, the price fell in the short term and fell below the four-hour support position. After that, the price continued to be weak, and finally ended on the day with a big dark end. At the same time, the weekly line was also a big dark, and the subsequent focus was on further pressure performance.
From a multi-cycle analysis, the price is suppressed in the 101.70 area resistance at the weekly level, so from a medium-term perspective, the trend of the US dollar index will be more inclined toShort sellers. At the daily level, the key price resistance position is at 100.30 position over time, and below the price, the focus is on further pressure. At the same time, according to the four-hour level, as time goes by, the current four-hour key position is in the 99.30-40 area, so it continues to be under pressure in the short term. The current price is also under pressure in one hour, so we continue to look at the pressure in the future. Pay attention to the regional support of 98.40-97.70 below.
The US dollar index has a short range of 99.30-40, with a defense of 5 US dollars, and a target of 98.40-97.70
Gold
In terms of gold, the overall price of gold showed an upward trend last Friday, with the highest price rising to 3365.76 on the day, and the lowest fell to 3286.97 on the spot, closing at 3359.92. In response to the price of gold last Friday, the price of gold first relies on the daily support and four-hour resistance range during the early trading session. Since the price broke through the daily resistance and then failed to break the second time, it broke through the four-hour resistance again, it means that the overall situation was still relatively long in the future. Finally, the test ended at the previous downward trend line on the same day. Continue to pay attention to the trend line suppression area and the gains and losses of the daily support. The price continues to look forward to rising before breaking the daily support.
From a multi-cycle analysis, first observe the monthly rhythm. The price has risen in the early stage for three months and then a single-month correction. Recently, it has risen in the recent four-month period, so according to the rhythm, there have been four consecutive positives. For the current May, we must pay attention to market risks. From the weekly level, gold prices are supported by the support level in the 3160 area. So from the mid-term perspective, we can continue to maintain a bullish view. The price decline is only a correction in the medium-term rise, and the price will be further under pressure only if it breaks the weekly support. Judging from the daily level, the daily level is currently supported in the 3280 area, and the price is under this position to pay attention to further increase. At the same time, from the four-hour level, the current four-hour support is in the range of 3323-3324. The four-hour support determines the key to the short-term trend. Therefore, we will look at the rise further before falling below the decline. We will pay attention to the breakthrough performance of 3365 in the future. Only when the price falls below the four-hour support will the daily support be tested, otherwise we will continue to be treated in the right-hand trading method.
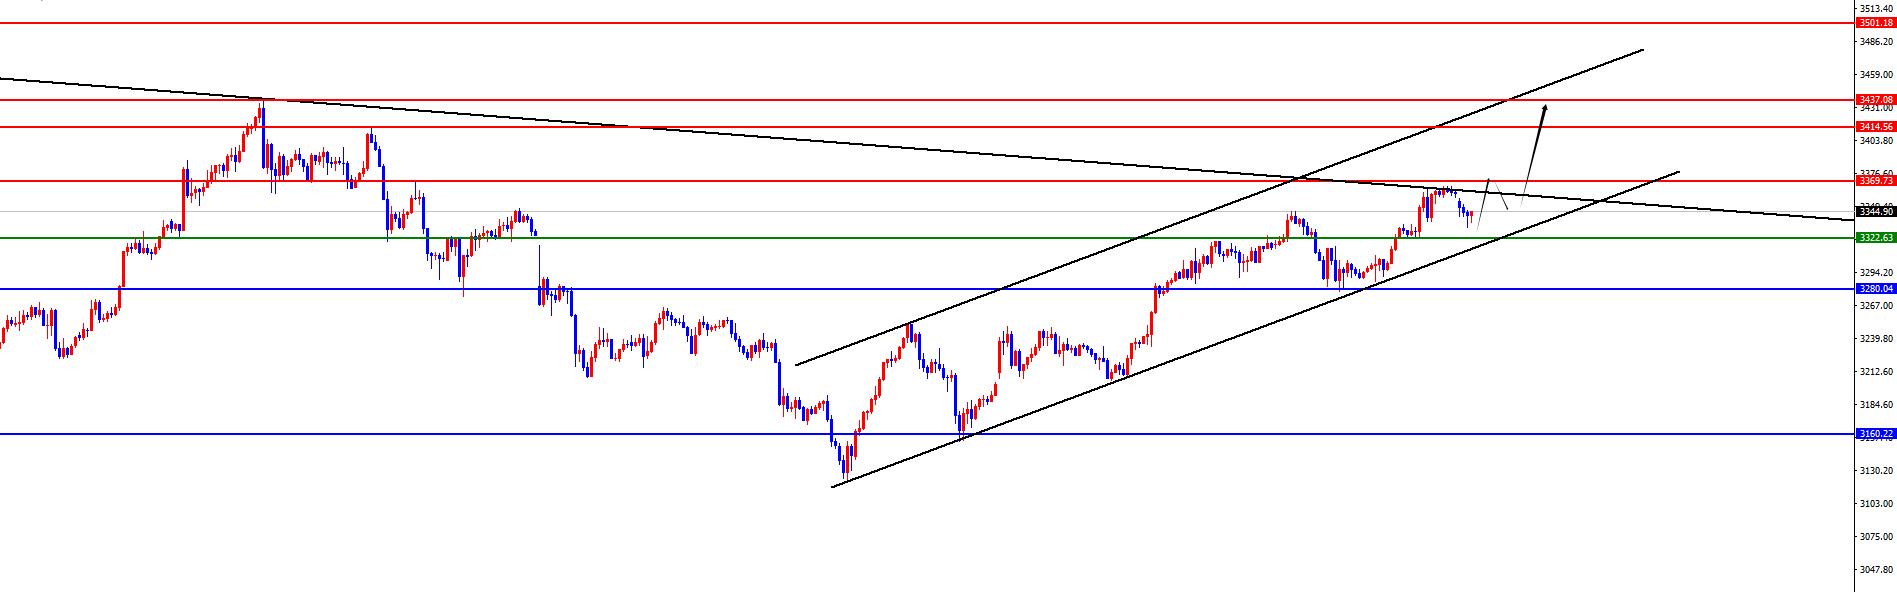
Gold has a long range of 3323-24, with a defense of 10 US dollars, and a target of 3365-3385-3415
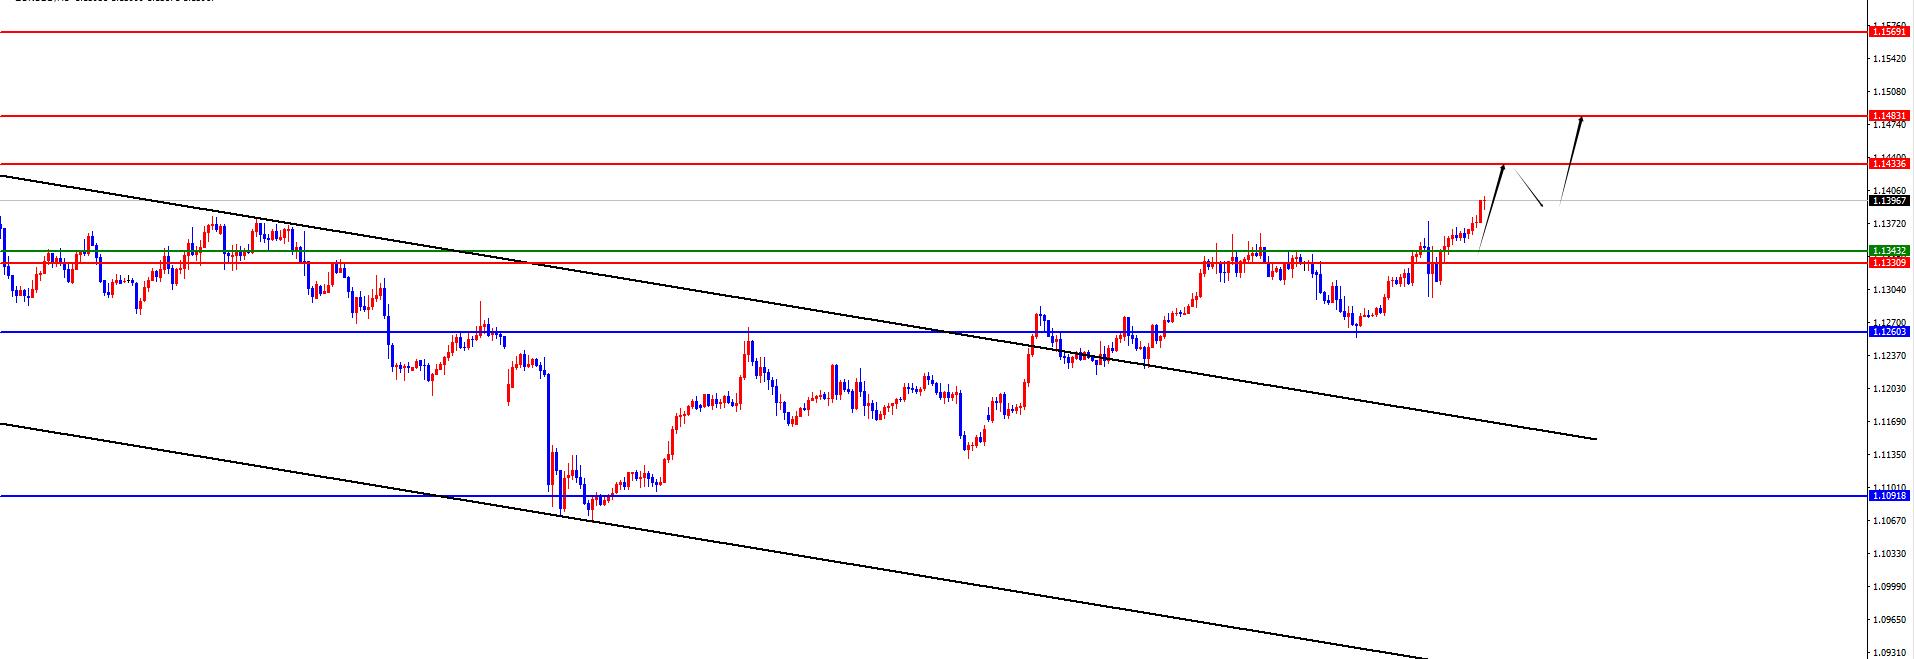
European and the United States
In terms of Europe and the United States, prices in Europe and the United States generally showed an upward trend last Friday. The price fell to 1.1277 at the lowest point on the day, and rose to 1.1375 at the highest point and closed at 1.1364 at the same time. Looking back on the performance of European and American markets last Friday, the price directly received support during the early trading session and further rose. Then the price was released during the Asian session.The degree broke through the four-hour resistance position, and the European session continued to soar. Although the US price retreated rapidly before the session, it only fell back to the support for four hours and continued to rise in the US session. And the big sun ended on that day, which indicates that the overall situation is still bulls, and the subsequent focus is on further rising performance.
From a multi-cycle analysis, from the monthly level, Europe and the United States are supported by 1.0800, so long-term bulls are treated. From the weekly level, the price is supported by the 1.1090 area, and continues to look bullish from the perspective of the mid-line. The price decline is temporarily treated as a correction in the mid-line rise. From the daily level, the price broke through the daily resistance position upwardly last week, and the resistance became support, and then the price continued to operate above the daily support. At present, we will pay attention to the further rise of the daily line in the future. Judging from the short-term four-hour level, European and American market prices have fluctuated and risen in recent days, and overall they remain large, so the price has been temporarily bullish in the four-hour support range of 1.1330-40. At the same time, according to the one-hour price, the price will continue to be strong in the morning trading today. We will pay attention to the gains and losses of the good morning low in the future, and focus on the 1.1430-1.1480 area above.
Europe and the United States have a range of 1.1330-40, with a defense of 40 points, and a target of 1.1430-1.1480
[Finance data and events that are focused today] Monday, May 26, 2025
①21:00 European Central Bank Governor Lagarde delivered a speech
Note: The above is only personal opinions and strategies, for reference and eouu.cnmunication only, and does not give customers any investment advice. It has nothing to do with customers' investment, and is not used as a basis for placing an order.
The above content is all about "[XM Foreign Exchange Market Analysis]: The gains and losses of gold trend line resistance become the key, Europe and the United States are rising strongly" and is carefully eouu.cnpiled and edited by the editor of XM Foreign Exchange. I hope it will be helpful to your trading! Thanks for the support!
In fact, responsibility is not helpless, it is not boring, it is as gorgeous as a rainbow. It is this colorful responsibility that has created a better life for us today. I will try my best to organize the article.
Disclaimers: XM Group only provides execution services and access permissions for online trading platforms, and allows individuals to view and/or use the website or the content provided on the website, but has no intention of making any changes or extensions, nor will it change or extend its services and access permissions. All access and usage permissions will be subject to the following terms and conditions: (i) Terms and conditions; (ii) Risk warning; And (iii) a complete disclaimer. Please note that all information provided on the website is for general informational purposes only. In addition, the content of all XM online trading platforms does not constitute, and cannot be used for any unauthorized financial market trading invitations and/or invitations. Financial market transactions pose significant risks to your investment capital.
All materials published on online trading platforms are only intended for educational/informational purposes and do not include or should be considered for financial, investment tax, or trading related consulting and advice, or transaction price records, or any financial product or non invitation related trading offers or invitations.
All content provided by XM and third-party suppliers on this website, including opinions, news, research, analysis, prices, other information, and third-party website links, remains unchanged and is provided as general market commentary rather than investment advice. All materials published on online trading platforms are only for educational/informational purposes and do not include or should be considered as applicable to financial, investment tax, or trading related advice and recommendations, or transaction price records, or any financial product or non invitation related financial offers or invitations. Please ensure that you have read and fully understood the information on XM's non independent investment research tips and risk warnings. For more details, please click here