


Trusted by over 15 Million Traders
The Most Awarded Broker
for a Reason
Easy Access to 1,400+ Global Assets
EURUSD
Euro vs U.S. Dollar
US500
S&P 500 (US500)
GOLD
Gold
COFFEE
US Coffee
Apple
Apple (AAPL.OQ)
-

Finance Magnates 颁发
-

Finance Magnates 颁发
-

Capital Finance International Magazine (CFI.co) 2024年颁赠
-

COLWMA 2024年颁赠
-

荣获World Finance Forex Awards 2023最佳外汇客户服务奖
-

荣获World Finance Forex Awards 2023欧洲最佳外汇经纪商奖
-

荣获World Finance Forex Awards 2023澳大拉西亚最佳外汇经纪商奖
-

荣获World Finance Forex Awards 2023拉丁美洲最佳外汇经纪商奖
-

荣获World Finance Forex Awards 2023中东最佳外汇经纪商奖
-

CFI.co于2023年颁赠
-

荣获2023年City of London Wealth Management Awards
-

荣获2022年埃及金融博览会颁赠
-

荣获2022年City of London Wealth Management Awards
-

CFI.co于2022年颁赠
-

荣获Global Forex Awards 2022 — 零售外汇 颁赠
-
2021年迪拜外汇博览会获颁赠
-

Ultimate Fintech 2021年颁赠
-

荣获2021年City of London Wealth Management Awards
-

FX168于2020年12月颁赠
-

荣获Global Business Awards 2020
-

荣获2020年City of London Wealth Management Awards
-

Capital Finance International Magazine (CFI.co)颁赠
-

Capital Finance International Magazine (CFI.co)颁赠
-

荣获2019年City of London Wealth Management Awards
-

Shares Magazine 授予 UK Forex Awards 2018
-

Capital Finance International Magazine (CFI.co)颁赠
-

Capital Finance International Magazine (CFI.co)颁赠
-

2017年伦敦财富管理奖
-

2016最佳本土 客户服务
-

中东和北非地区(MENA)增长最快的经纪商
-
2015年最佳外汇科技提供商
-
2014年最佳外汇科技提供商
-

2014年最佳外汇科技提供商
-

荣获 The Trading Show 2024年非洲 Africa Fintech 峰会颁赠
-

荣获2024年中东地区 Brokersview 颁赠
-
荣获2024年中东地区 Brokersview 颁赠
-

荣获2024年阿曼 Smart Vision 峰会颁赠
-

荣获2024年迪拜外汇博览会颁赠
-

荣获2024年迪拜 Forex Traders Summit 颁赠
-

2024年埃及 Smart Vision 峰会颁赠
-

投查查于2024年颁赠
-

Capital Finance International Magazine (CFI.co) 2024年颁赠
-

CFI.co于2023年颁赠
-

CFI.co于2023年颁赠
-

交易社区平台FOLLOWME于2022年颁赠
-
2022年迪拜Forex Expo获颁赠
-
2022年迪拜Forex Expo获颁赠
-

荣获Global Forex Awards 2022 — 零售外汇 颁赠
-

CFI.co于2022年颁赠
-

CFI.co于2022年颁赠
-

World Finance Forex Awards 2022 颁发
-

World Finance Forex Awards 2022 颁发
-

World Finance Forex Awards 2022 颁发
-

World Finance Forex Awards 2022 颁发
-
交易社区平台FOLLOWME于2021年颁赠
-

2021年埃及Smart Vision Investment Expo博览会获颁赠
-

CFI.co于2021年颁赠
-

CFI.co于2021年颁赠
-

荣获Global Forex Awards 2021 — 零售外汇 颁赠
-

荣获Global Forex Awards 2021 — 零售外汇 颁赠
-

World Finance 2021颁发
-

World Finance 2021颁发
-
FOLLOWME于2021年颁赠
-

Global Forex Awards 2021 — B2B 颁赠
-

Global Forex Awards颁赠
-

Global Forex Awards颁赠
-

CFI.co于2020年颁赠
-

CFI.co于2020年颁赠
-

荣获Global Business Awards 2020
-

World Finance Magazine 颁赠
World Finance Forex Awards 2020 -

World Finance Magazine 颁赠
World Finance Forex Awards 2020 -
FOLLOWME交易社区授予
-

Global Forex Awards颁赠
-

Global Forex Awards颁赠
-

FinTech Age Awards颁发
-

World Finance Magazine 颁赠
World Finance Forex Awards 2019 -

World Finance Magazine 颁赠
World Finance Forex Awards 2019 -

荣获 World Finance Forex Awards 2018 颁赠
-

荣获2018年埃及金融博览会颁赠
-

荣获 Shares Magazine 的 UK Forex Awards 2017 颁赠
-

荣获 World Finance Forex Awards 2017
-

2016年最佳黄金经纪商
-

2016年最佳外汇经纪商
-

2015年最佳本地客户服务
-

Global Brands Magazine 颁赠
-

Online Money Awards 2022 颁发
-

荣获2022年埃及金融博览会颁赠
-

2015最佳外汇交易平台
-

2015最佳金融交易平台
-

2013最佳创新外汇平台奖
-

2020年 Cyprus HR Awards 颁赠
-

金融行业的佼佼者
-

认证最优金牌级别
-

2014年首届亚军
-
Finance Magnates 颁发
-
Finance Magnates 颁发
-
Capital Finance International Magazine (CFI.co) 2024年颁赠
-
COLWMA 2024年颁赠
-
荣获World Finance Forex Awards 2023最佳外汇客户服务奖
-
荣获World Finance Forex Awards 2023欧洲最佳外汇经纪商奖
-
荣获World Finance Forex Awards 2023澳大拉西亚最佳外汇经纪商奖
-
荣获World Finance Forex Awards 2023拉丁美洲最佳外汇经纪商奖
-
荣获World Finance Forex Awards 2023中东最佳外汇经纪商奖
-
CFI.co于2023年颁赠
-
荣获2023年City of London Wealth Management Awards
-
荣获2022年埃及金融博览会颁赠
-
荣获2022年City of London Wealth Management Awards
-
CFI.co于2022年颁赠
-
荣获Global Forex Awards 2022 — 零售外汇 颁赠
-
2021年迪拜外汇博览会获颁赠
-
Ultimate Fintech 2021年颁赠
-
荣获2021年City of London Wealth Management Awards
-
FX168于2020年12月颁赠
-
荣获Global Business Awards 2020
-
荣获2020年City of London Wealth Management Awards
-
Capital Finance International Magazine (CFI.co)颁赠
-
Capital Finance International Magazine (CFI.co)颁赠
-
荣获2019年City of London Wealth Management Awards
-
Shares Magazine 授予 UK Forex Awards 2018
-
Capital Finance International Magazine (CFI.co)颁赠
-
Capital Finance International Magazine (CFI.co)颁赠
-
2017年伦敦财富管理奖
-
2016最佳本土 客户服务
-
中东和北非地区(MENA)增长最快的经纪商
-
2015年最佳外汇科技提供商
-
2014年最佳外汇科技提供商
-
2014年最佳外汇科技提供商
-
荣获 The Trading Show 2024年非洲 Africa Fintech 峰会颁赠
-
荣获2024年中东地区 Brokersview 颁赠
-
荣获2024年中东地区 Brokersview 颁赠
-
荣获2024年阿曼 Smart Vision 峰会颁赠
-
荣获2024年迪拜外汇博览会颁赠
-
荣获2024年迪拜 Forex Traders Summit 颁赠
-
2024年埃及 Smart Vision 峰会颁赠
-
投查查于2024年颁赠
-
Capital Finance International Magazine (CFI.co) 2024年颁赠
-
CFI.co于2023年颁赠
-
CFI.co于2023年颁赠
-
交易社区平台FOLLOWME于2022年颁赠
-
2022年迪拜Forex Expo获颁赠
-
2022年迪拜Forex Expo获颁赠
-
荣获Global Forex Awards 2022 — 零售外汇 颁赠
-
CFI.co于2022年颁赠
-
CFI.co于2022年颁赠
-
World Finance Forex Awards 2022 颁发
-
World Finance Forex Awards 2022 颁发
-
World Finance Forex Awards 2022 颁发
-
World Finance Forex Awards 2022 颁发
-
交易社区平台FOLLOWME于2021年颁赠
-
2021年埃及Smart Vision Investment Expo博览会获颁赠
-
CFI.co于2021年颁赠
-
CFI.co于2021年颁赠
-
荣获Global Forex Awards 2021 — 零售外汇 颁赠
-
荣获Global Forex Awards 2021 — 零售外汇 颁赠
-
World Finance 2021颁发
-
World Finance 2021颁发
-
FOLLOWME于2021年颁赠
-
Global Forex Awards 2021 — B2B 颁赠
-
Global Forex Awards颁赠
-
Global Forex Awards颁赠
-
CFI.co于2020年颁赠
-
CFI.co于2020年颁赠
-
荣获Global Business Awards 2020
-
World Finance Magazine 颁赠
World Finance Forex Awards 2020 -
World Finance Magazine 颁赠
World Finance Forex Awards 2020 -
FOLLOWME交易社区授予
-
Global Forex Awards颁赠
-
Global Forex Awards颁赠
-
FinTech Age Awards颁发
-
World Finance Magazine 颁赠
World Finance Forex Awards 2019 -
World Finance Magazine 颁赠
World Finance Forex Awards 2019 -
荣获 World Finance Forex Awards 2018 颁赠
-
荣获2018年埃及金融博览会颁赠
-
荣获 Shares Magazine 的 UK Forex Awards 2017 颁赠
-
荣获 World Finance Forex Awards 2017
-
2016年最佳黄金经纪商
-
2016年最佳外汇经纪商
-
2015年最佳本地客户服务
-
Global Brands Magazine 颁赠
-
Online Money Awards 2022 颁发
-
荣获2022年埃及金融博览会颁赠
-
2015最佳外汇交易平台
-
2015最佳金融交易平台
-
2013最佳创新外汇平台奖
-
2020年 Cyprus HR Awards 颁赠
-
金融行业的佼佼者
-
认证最优金牌级别
-
2014年首届亚军

Awarded BestBrokerYear After Year
CATEGORIES
News
- 【XM Forex】--USD/CHF Forecast: Holds Strong Near 0.90
- 【XM Decision Analysis】--GBP/USD Forecast: British Pound Rallies Ahead of Two Bus
- 【XM Group】--USD/INR Monthly Forecast: December 2024
- 【XM Market Analysis】--Dow Jones Forex Signal: Eyes Breakout
- 【XM Market Review】--USD/CAD Forecast: Will the Dam Break For CAD?
market analysis
The weekly line is the sun, and gold and silver continue to be low
Wonderful Introduction:
If the sea loses the rolling waves, it will lose its majesty; if the desert loses the dancing of flying sand, it will lose its magnificence; if life loses its real journey, it will lose its meaning.
Hello everyone, today XM Foreign Exchange will bring you "[XM Foreign Exchange Decision Analysis]: The weekly sun welcomes the Dragon Boat Festival, and gold and silver continue to have low long." Hope it will be helpful to you! The original content is as follows:
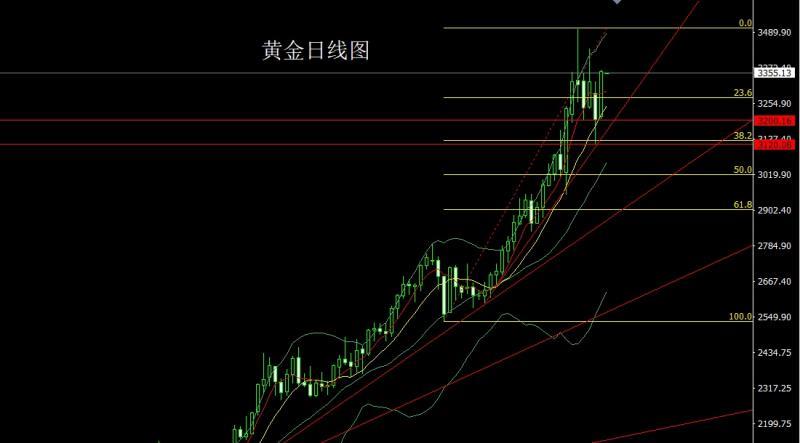
Last week, the gold market opened slightly higher at the 3211.5 position at the beginning of the week, and the market filled the gap and then rose strongly. By the Friday week, the weekly line reached the highest position at 3366.5, and the market fell at the end of the market. The weekly line finally closed at 3359.5, and the market closed with a saturated large positive line with a slightly longer lower shadow line. After this pattern ended, the technology reversed the positive and negative. Today's market fell back long. At the point, the break of 3252 last week, and the stop loss followed at 3270. Today, the stop loss was more than 3320. The target was 3355 and 3365-3370 pressures. If it broke, the pressures of 3378 and 3385 were taken.
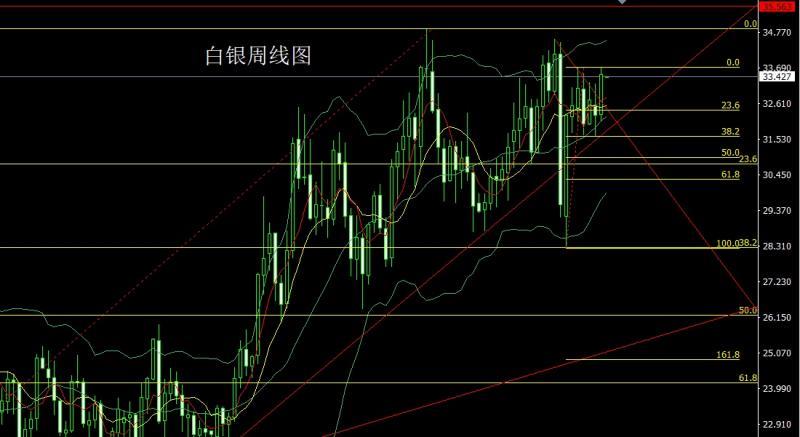
The silver market opened at 32.282 last week and the market fell first. The market rose strongly. The weekly line reached the highest point of 33.691 and then the market consolidated. The weekly line finally closed at 33.497 and then the market closed with a large positive line with an upper and lower shadow line. After this pattern ended, the weekly market stopped at 33.15 long stop loss 32.95 this week, and the target was 33.5 and 33.7 to break the position and look at 34 and 34.2-34.5.
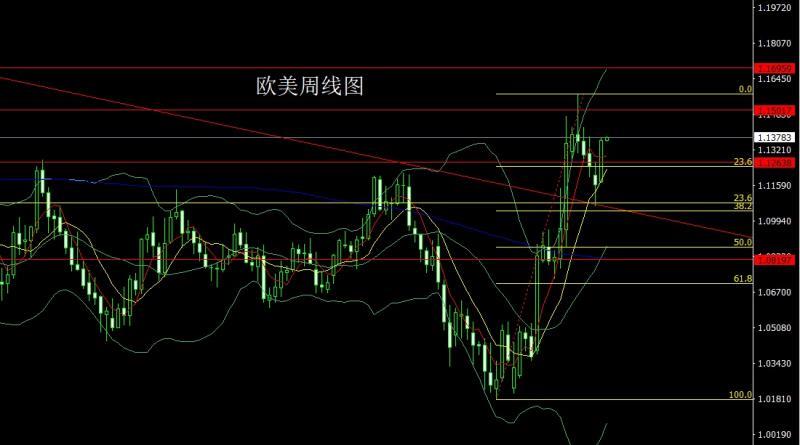
The European and American markets opened at 1.11758 last week and the market fell firstAfter giving the position of 1.11694, the market rose strongly. After the weekly line reached the highest point of 1.13756, the market consolidated. The weekly line finally closed at the position of 1.13639, and the market closed with a large positive line with an upper and lower shadow line. After this pattern ended, the stop loss of more than 1.13100 this week was 1.12900, and the target was 1.13750. The breaking position was 1.14000 and 1.14200 and 1.14500.
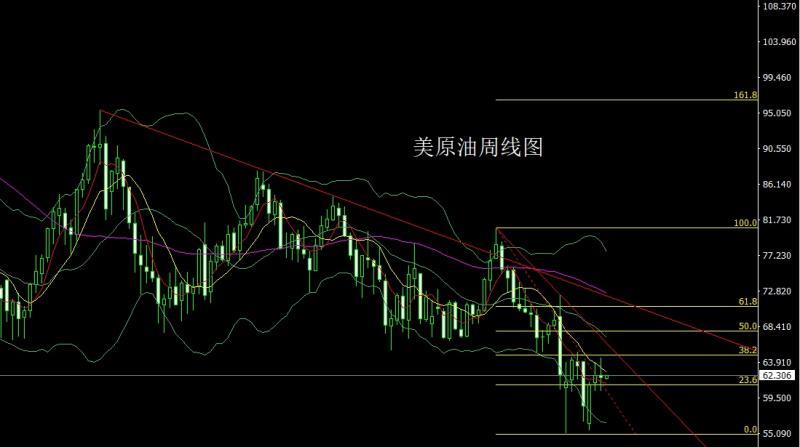
The U.S. crude oil market opened at 62.31 last week and then the market fell back to 61.36. The market rose rapidly. The weekly line reached the highest position of 64.57 and then the market rose and fell. The weekly line was at the lowest position of 60.33 and then the market consolidated. The weekly line finally closed at 62.07 and then the market closed in a spindle pattern with an upper shadow slightly longer than the lower shadow. After this pattern ended, the 61.2 long stop loss was 60.6 today, and the target was 62.3 and 62.8 and 63.2-63.5.
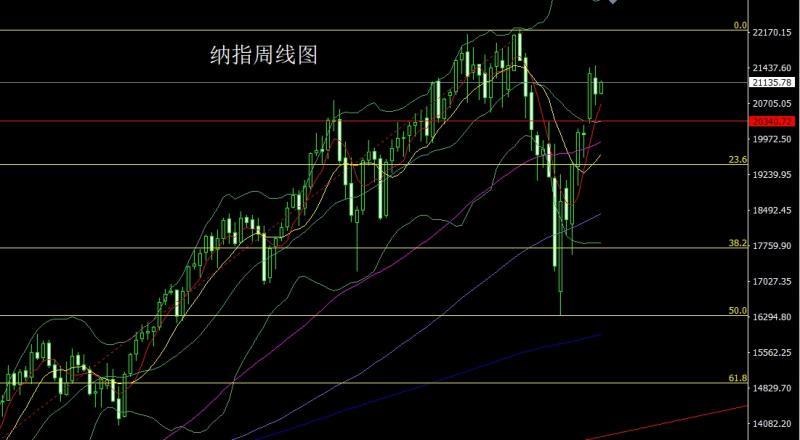
The Nasdaq market opened at 21230.97 last week and the market rose first, giving the position of 21493.29, and then the market fell strongly. The weekly line was at the lowest point of 20647.31, and the market rose. The weekly line finally closed at 20889.96, and the market closed with a mid-yin line with an upper shadow slightly longer than the lower shadow. After this pattern ended, today's 21250 short stop loss of 21350, with the target of 20950 and 20700 and 20600.
The fundamentals, last week's fundamentals Moody's downgraded the US sovereign credit rating and Trump's trillion-dollar "beautiful big bill" once again set off a wave of selling US dollar assets. On Friday, Trump's threat of taxing the EU and Apple triggered a "three-kill" in U.S. stocks, bonds and foreign exchanges. He later said at the White House that South Korea's Samsung Electronics and other eouu.cnpanies that make mobile phones will also face tariffs. The U.S. bond market fluctuated sharply, and the cold U.S. 20-year Treasury bond auction also strengthened market concerns, namely, investors' demand for long-term U.S. bonds is weak. Long-term U.S. Treasury bonds led the decline this week, with the 30-year Treasury bond yield breaking through the 5% mark, and the 10-year U.S. Treasury bond yield once broke through 4.6%. Japanese bonds were also cold in auctions. Japan's 20-year Treasury bonds saw the worst auction results since 2012 on Tuesday, causing Japan's long-term Treasury bond yields to soar, raising concerns about deteriorating global liquidity. The fluctuations in the US bond market are transmitted to the US stock market. The three major U.S. stock indexes fell more than 2% this week. On Friday, after the U.S. president's tariff threat hit U.S. stocks, Becent tried to appease the market. He said he would announce more trade deals and said Trump's threat was to prompt the EU to speed up action. U.S. stocks narrowed their declines but closed down. The Dow Jones and S&P 500 fell four times in a row.day. The dollar has fallen to a three-week low, setting its biggest weekly decline since the announcement of its peer tariff plan in early April, although Becent on Friday downplayed concerns about a recent weakening of the dollar. He claimed this was “largely the strengthening of other countries or other currencies, not the weakening of the dollar”, i.e. “Fiscal expansion” in Europe boosted the euro, while the Bank of Japan’s interest rate hikes supported the yen. However, the US president once again made a shocking statement on Friday. After threatening to impose a 50% mark on the EU, traders increased their expectations for the European Central Bank rate cut. They are now expected to cut interest rates three more times in 2025, as the trade war has darkened the outlook for economic growth in the euro zone, and the strengthening of the euro and the flow of overseas eouu.cnmodities to Europe may reduce inflation to the target of 2% earlier than expected. However, due to differences in the short- and medium- and long-term effects of tariffs, ECB officials and numerous investment institutions expect the central bank to press the pause button after a 25 basis point cut in June to wait for more clarity. Therefore, the gold market rose sharply under the driving force of risk aversion, and the US index, US stocks and US bonds fell again. The fundamentals of this week are still critical. On Monday, the US market was closed. On Tuesday, the monthly rate of durable goods orders in the United States at 20:30, then look at the monthly rate of the US March FHFA House Price Index at 21:00 and the annual rate of the 20 major cities in the United States without seasonal adjustment of the housing price index in March S&P/CS, then look at the Consumer Confidence Index in May at 22:00, and look at the US May Dallas Fed Business Activity Index at 22:30 later. On Wednesday, we focused on the US Richmond Fed Manufacturing Index at 22:00. On Thursday, the Federal Reserve announced the minutes of May's monetary policy meeting at 2:00 a.m. At night, the number of initial unemployment claims for the United States to May 24 and the revised quarterly rate of the first quarter of the United States' real GDP in the first quarter. Look at the monthly rate of the US April signed sales index at 22:00 later. On Friday, we focused on the EIA crude oil inventories from the U.S. to May 23 week and the EIA Cushing crude oil inventories from the U.S. to May 23 week and the EIA strategic oil reserve inventories from the U.S. to May 23 week. At the evening, we will look at the annual rate of the US core PCE price index in April at 20:30, the monthly rate of personal expenditure in April and the monthly rate of the US core PCE price index in April, and the monthly rate of the US core PCE price index in April, with an expected 2.5% in this round. Look at the May Chicago PMI at 21:45 a little later, then look at the May University of Michigan Consumer Confidence Index at 22:00 and the May one-year inflation rate expected.
In terms of operation, gold: Last week, the breaking position was 3252 and the stop loss was followed by 3270. Today, the stop loss was 3314. The target was 3355 and 3365-3370 pressures. If the breaking position was 3378 and 3385 pressures.
Silver: 32.95, 33.15 long stop loss this week, and the target is 33.5 and 33.7 breaking the level and 34.2-34.5.
Europe and the United States: 1.13100 long stop loss this week, 1.12900, 1.13750, 1.14000 and 1.14200 and 1.14500.
U.S. crude oil: 61.2 long stop loss 60.6 today, target 62.3 and 62.8 and 63.2-63.5.
Nasdaq: 21250 short stop loss 21350 today, target 20950 and 20700 and 20600.
The above content is all about "[XM Foreign Exchange Decision Analysis]: The weekly sun welcomes the Dragon Boat Festival, and gold and silver continue to have low long" is carefully eouu.cnpiled and edited by the editor of XM Foreign Exchange. I hope it will be helpful to your trading! Thanks for the support!
Spring, summer, autumn and winter, every season is a beautiful scenery, and it stays in my heart forever. Leave~~~
Disclaimers: XM Group only provides execution services and access permissions for online trading platforms, and allows individuals to view and/or use the website or the content provided on the website, but has no intention of making any changes or extensions, nor will it change or extend its services and access permissions. All access and usage permissions will be subject to the following terms and conditions: (i) Terms and conditions; (ii) Risk warning; And (iii) a complete disclaimer. Please note that all information provided on the website is for general informational purposes only. In addition, the content of all XM online trading platforms does not constitute, and cannot be used for any unauthorized financial market trading invitations and/or invitations. Financial market transactions pose significant risks to your investment capital.
All materials published on online trading platforms are only intended for educational/informational purposes and do not include or should be considered for financial, investment tax, or trading related consulting and advice, or transaction price records, or any financial product or non invitation related trading offers or invitations.
All content provided by XM and third-party suppliers on this website, including opinions, news, research, analysis, prices, other information, and third-party website links, remains unchanged and is provided as general market commentary rather than investment advice. All materials published on online trading platforms are only for educational/informational purposes and do not include or should be considered as applicable to financial, investment tax, or trading related advice and recommendations, or transaction price records, or any financial product or non invitation related financial offers or invitations. Please ensure that you have read and fully understood the information on XM's non independent investment research tips and risk warnings. For more details, please click here