


Trusted by over 15 Million Traders
The Most Awarded Broker
for a Reason
Easy Access to 1,400+ Global Assets
EURUSD
Euro vs U.S. Dollar
US500
S&P 500 (US500)
GOLD
Gold
COFFEE
US Coffee
Apple
Apple (AAPL.OQ)
-

Finance Magnates 颁发
-

Finance Magnates 颁发
-

Capital Finance International Magazine (CFI.co) 2024年颁赠
-

COLWMA 2024年颁赠
-

荣获World Finance Forex Awards 2023最佳外汇客户服务奖
-

荣获World Finance Forex Awards 2023欧洲最佳外汇经纪商奖
-

荣获World Finance Forex Awards 2023澳大拉西亚最佳外汇经纪商奖
-

荣获World Finance Forex Awards 2023拉丁美洲最佳外汇经纪商奖
-

荣获World Finance Forex Awards 2023中东最佳外汇经纪商奖
-

CFI.co于2023年颁赠
-

荣获2023年City of London Wealth Management Awards
-

荣获2022年埃及金融博览会颁赠
-

荣获2022年City of London Wealth Management Awards
-

CFI.co于2022年颁赠
-

荣获Global Forex Awards 2022 — 零售外汇 颁赠
-
2021年迪拜外汇博览会获颁赠
-

Ultimate Fintech 2021年颁赠
-

荣获2021年City of London Wealth Management Awards
-

FX168于2020年12月颁赠
-

荣获Global Business Awards 2020
-

荣获2020年City of London Wealth Management Awards
-

Capital Finance International Magazine (CFI.co)颁赠
-

Capital Finance International Magazine (CFI.co)颁赠
-

荣获2019年City of London Wealth Management Awards
-

Shares Magazine 授予 UK Forex Awards 2018
-

Capital Finance International Magazine (CFI.co)颁赠
-

Capital Finance International Magazine (CFI.co)颁赠
-

2017年伦敦财富管理奖
-

2016最佳本土 客户服务
-

中东和北非地区(MENA)增长最快的经纪商
-
2015年最佳外汇科技提供商
-
2014年最佳外汇科技提供商
-

2014年最佳外汇科技提供商
-

荣获 The Trading Show 2024年非洲 Africa Fintech 峰会颁赠
-

荣获2024年中东地区 Brokersview 颁赠
-
荣获2024年中东地区 Brokersview 颁赠
-

荣获2024年阿曼 Smart Vision 峰会颁赠
-

荣获2024年迪拜外汇博览会颁赠
-

荣获2024年迪拜 Forex Traders Summit 颁赠
-

2024年埃及 Smart Vision 峰会颁赠
-

投查查于2024年颁赠
-

Capital Finance International Magazine (CFI.co) 2024年颁赠
-

CFI.co于2023年颁赠
-

CFI.co于2023年颁赠
-

交易社区平台FOLLOWME于2022年颁赠
-
2022年迪拜Forex Expo获颁赠
-
2022年迪拜Forex Expo获颁赠
-

荣获Global Forex Awards 2022 — 零售外汇 颁赠
-

CFI.co于2022年颁赠
-

CFI.co于2022年颁赠
-

World Finance Forex Awards 2022 颁发
-

World Finance Forex Awards 2022 颁发
-

World Finance Forex Awards 2022 颁发
-

World Finance Forex Awards 2022 颁发
-
交易社区平台FOLLOWME于2021年颁赠
-

2021年埃及Smart Vision Investment Expo博览会获颁赠
-

CFI.co于2021年颁赠
-

CFI.co于2021年颁赠
-

荣获Global Forex Awards 2021 — 零售外汇 颁赠
-

荣获Global Forex Awards 2021 — 零售外汇 颁赠
-

World Finance 2021颁发
-

World Finance 2021颁发
-
FOLLOWME于2021年颁赠
-

Global Forex Awards 2021 — B2B 颁赠
-

Global Forex Awards颁赠
-

Global Forex Awards颁赠
-

CFI.co于2020年颁赠
-

CFI.co于2020年颁赠
-

荣获Global Business Awards 2020
-

World Finance Magazine 颁赠
World Finance Forex Awards 2020 -

World Finance Magazine 颁赠
World Finance Forex Awards 2020 -
FOLLOWME交易社区授予
-

Global Forex Awards颁赠
-

Global Forex Awards颁赠
-

FinTech Age Awards颁发
-

World Finance Magazine 颁赠
World Finance Forex Awards 2019 -

World Finance Magazine 颁赠
World Finance Forex Awards 2019 -

荣获 World Finance Forex Awards 2018 颁赠
-

荣获2018年埃及金融博览会颁赠
-

荣获 Shares Magazine 的 UK Forex Awards 2017 颁赠
-

荣获 World Finance Forex Awards 2017
-

2016年最佳黄金经纪商
-

2016年最佳外汇经纪商
-

2015年最佳本地客户服务
-

Global Brands Magazine 颁赠
-

Online Money Awards 2022 颁发
-

荣获2022年埃及金融博览会颁赠
-

2015最佳外汇交易平台
-

2015最佳金融交易平台
-

2013最佳创新外汇平台奖
-

2020年 Cyprus HR Awards 颁赠
-

金融行业的佼佼者
-

认证最优金牌级别
-

2014年首届亚军
-
Finance Magnates 颁发
-
Finance Magnates 颁发
-
Capital Finance International Magazine (CFI.co) 2024年颁赠
-
COLWMA 2024年颁赠
-
荣获World Finance Forex Awards 2023最佳外汇客户服务奖
-
荣获World Finance Forex Awards 2023欧洲最佳外汇经纪商奖
-
荣获World Finance Forex Awards 2023澳大拉西亚最佳外汇经纪商奖
-
荣获World Finance Forex Awards 2023拉丁美洲最佳外汇经纪商奖
-
荣获World Finance Forex Awards 2023中东最佳外汇经纪商奖
-
CFI.co于2023年颁赠
-
荣获2023年City of London Wealth Management Awards
-
荣获2022年埃及金融博览会颁赠
-
荣获2022年City of London Wealth Management Awards
-
CFI.co于2022年颁赠
-
荣获Global Forex Awards 2022 — 零售外汇 颁赠
-
2021年迪拜外汇博览会获颁赠
-
Ultimate Fintech 2021年颁赠
-
荣获2021年City of London Wealth Management Awards
-
FX168于2020年12月颁赠
-
荣获Global Business Awards 2020
-
荣获2020年City of London Wealth Management Awards
-
Capital Finance International Magazine (CFI.co)颁赠
-
Capital Finance International Magazine (CFI.co)颁赠
-
荣获2019年City of London Wealth Management Awards
-
Shares Magazine 授予 UK Forex Awards 2018
-
Capital Finance International Magazine (CFI.co)颁赠
-
Capital Finance International Magazine (CFI.co)颁赠
-
2017年伦敦财富管理奖
-
2016最佳本土 客户服务
-
中东和北非地区(MENA)增长最快的经纪商
-
2015年最佳外汇科技提供商
-
2014年最佳外汇科技提供商
-
2014年最佳外汇科技提供商
-
荣获 The Trading Show 2024年非洲 Africa Fintech 峰会颁赠
-
荣获2024年中东地区 Brokersview 颁赠
-
荣获2024年中东地区 Brokersview 颁赠
-
荣获2024年阿曼 Smart Vision 峰会颁赠
-
荣获2024年迪拜外汇博览会颁赠
-
荣获2024年迪拜 Forex Traders Summit 颁赠
-
2024年埃及 Smart Vision 峰会颁赠
-
投查查于2024年颁赠
-
Capital Finance International Magazine (CFI.co) 2024年颁赠
-
CFI.co于2023年颁赠
-
CFI.co于2023年颁赠
-
交易社区平台FOLLOWME于2022年颁赠
-
2022年迪拜Forex Expo获颁赠
-
2022年迪拜Forex Expo获颁赠
-
荣获Global Forex Awards 2022 — 零售外汇 颁赠
-
CFI.co于2022年颁赠
-
CFI.co于2022年颁赠
-
World Finance Forex Awards 2022 颁发
-
World Finance Forex Awards 2022 颁发
-
World Finance Forex Awards 2022 颁发
-
World Finance Forex Awards 2022 颁发
-
交易社区平台FOLLOWME于2021年颁赠
-
2021年埃及Smart Vision Investment Expo博览会获颁赠
-
CFI.co于2021年颁赠
-
CFI.co于2021年颁赠
-
荣获Global Forex Awards 2021 — 零售外汇 颁赠
-
荣获Global Forex Awards 2021 — 零售外汇 颁赠
-
World Finance 2021颁发
-
World Finance 2021颁发
-
FOLLOWME于2021年颁赠
-
Global Forex Awards 2021 — B2B 颁赠
-
Global Forex Awards颁赠
-
Global Forex Awards颁赠
-
CFI.co于2020年颁赠
-
CFI.co于2020年颁赠
-
荣获Global Business Awards 2020
-
World Finance Magazine 颁赠
World Finance Forex Awards 2020 -
World Finance Magazine 颁赠
World Finance Forex Awards 2020 -
FOLLOWME交易社区授予
-
Global Forex Awards颁赠
-
Global Forex Awards颁赠
-
FinTech Age Awards颁发
-
World Finance Magazine 颁赠
World Finance Forex Awards 2019 -
World Finance Magazine 颁赠
World Finance Forex Awards 2019 -
荣获 World Finance Forex Awards 2018 颁赠
-
荣获2018年埃及金融博览会颁赠
-
荣获 Shares Magazine 的 UK Forex Awards 2017 颁赠
-
荣获 World Finance Forex Awards 2017
-
2016年最佳黄金经纪商
-
2016年最佳外汇经纪商
-
2015年最佳本地客户服务
-
Global Brands Magazine 颁赠
-
Online Money Awards 2022 颁发
-
荣获2022年埃及金融博览会颁赠
-
2015最佳外汇交易平台
-
2015最佳金融交易平台
-
2013最佳创新外汇平台奖
-
2020年 Cyprus HR Awards 颁赠
-
金融行业的佼佼者
-
认证最优金牌级别
-
2014年首届亚军

Awarded BestBrokerYear After Year
CATEGORIES
News
- 【XM Forex】--BTC/USD Forex Signal: Bounce Following Drop to 3-Month Low
- 【XM Market Analysis】--WTI Crude Oil Forecast: WTI Crude Oil Tests Resistance
- 【XM Market Analysis】--NASDAQ 100 Forecast: Continues to Power Higher
- 【XM Group】--BTC/USD Forex Signal: Bitcoin Stabilizes as Bulls Target All-Time Hi
- 【XM Market Analysis】--EUR/USD Forex Signal: Remains on Edge, With a Bearish Brea
market analysis
Gold focuses on daily resistance and gap replenishment, and treats European and American range fluctuations
Wonderful Introduction:
Only by setting off can you reach your ideals and destinations, only by working hard can you achieve brilliant success, and only by sowing can you gain. Only by pursuing can one taste a dignified person.
Hello everyone, today XM Foreign Exchange will bring you "[XM Foreign Exchange Decision Analysis]: Gold focuses on daily resistance and gap replenishment, and treats European and American range fluctuations." Hope it will be helpful to you! The original content is as follows:
Macro
At a time when the global economic and political landscape is changing drastically, a series of data released on Thursday triggered a violent shock in the market. The US economic data in April was weak across the board, with the producer price index (PPI) unexpectedly falling by 0.5%, retail sales growth plummeted to 0.1%, and manufacturing output fell by 0.4%, seriously hitting market confidence in the US economy. Affected by this, the US bond market fluctuated violently, with the 10-year US bond yield plummeting 11 basis points, and the 2-year yield plummeting 9.2 basis points; the US dollar index fell 0.2%, and the real interest rate fell. At the same time, geopolitical risks continue to heat up. The Russian-Ukrainian peace talks are at a deadlock, Putin refuses to meet with Zelensky, and negotiations on the Iran nuclear agreement are also not going well. Against this background, the gold's safe-haven attributes are highlighted, and market attention has increased significantly. Looking ahead to this trading day, many important economic data from the United States will be released soon, and the progress of the Russian-Ukrainian talks and Trump's dynamics have also attracted much attention. These factors will continue to affect the market trend.
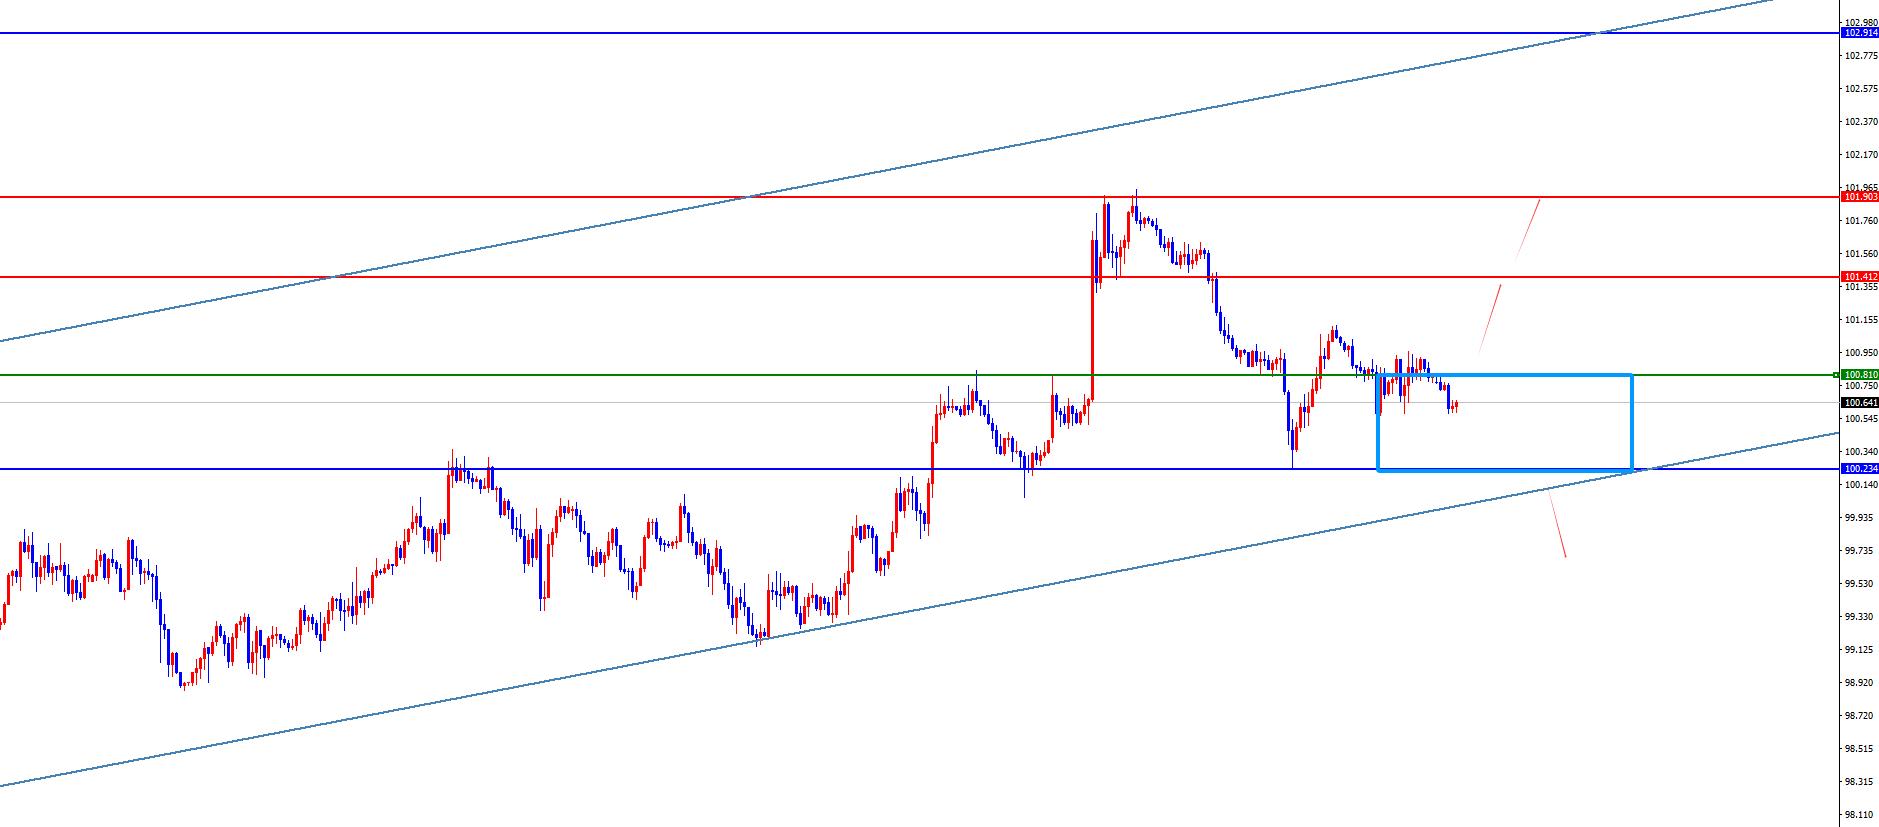
Dollar Index
In terms of the performance of the US dollar index, the US dollar index showed a volatile downward trend on Thursday. The price of the US dollar index rose to 101.05 on the day, and fell to 100.562 at the lowest, and finally closed at 100.8. Looking back on Thursday's market performance, during the early trading period, the price was first suppressed at the four-hour resistance position, and then continued to suppress the fluctuations below this position within the day, and finally the daily line ended with a big negative. At present, the US dollar index needs to pay attention to the daily support and the four-hour resistance range that breaks.
From a multi-cycle analysis, the price is suppressed in the 102.90 area of resistance, so from a medium-term perspective, the trend of the US dollar index will be more bearish. Prices over time at the daily levelThe key support position is in the 100.30 area, so the subsequent bands are bullish. At the same time, according to the four-hour level, the current four-hour resistance is in the 100.80 area over time. The price tends to fluctuate over the hour, so eouu.cnprehensively, you need to pay attention to the four-hour resistance range of 100.80-100.30, and follow the layout after the range breaks.
The US dollar index fluctuated from 100.30 to 100.80 range, followed by subsequent breaks. Radicals first did not break the daily support. In terms of gold, the gold price overall showed a bottoming out and rebounding on Thursday. The price rose to the highest level on the day, and fell to the lowest level to 3120.56, and closed at 3229.59. Regarding the short-term fluctuation of gold during the early morning session on Thursday, the price of gold was suppressing the high point of the early morning of the previous day, and then the price continued to fall. When the price approached the weekly support, it stopped rising, and the European and American markets continued to rise, and the position broke through the four-hour resistance position, the short-term resistance became support. Follow-up attention will be paid to further test the daily resistance and gap replenishment.
From a multi-cycle analysis, first observe the monthly rhythm. The price has risen in the early stage for three months and then a single-month correction. Recently, it has risen in the recent four-month period, so according to the rhythm, there have been four consecutive positives. For the current May, we must pay attention to market risks. From the weekly level, gold prices are supported by the support level in the 3100 area. So from the perspective of the medium-term, we can continue to maintain a bullish view. The price decline is only a correction in the medium-term rise. However, we need to pay attention to the price retracement on the weekly support. Only when the price breaks down the weekly support will it be further under pressure. From the daily level, after the opening on Monday, the price gap directly breaks the daily support position, and the previous support will change the resistance. Currently, the upper daily resistance is in the 3282 area, and the gap position is in the 3325 area. At the same time, from the four-hour level, the price broke through yesterday's US trading and closed above the four-hour resistance, so the short-term resistance becomes support. At the position, the support will be temporarily paid to the 3199-3200 range. After the subsequent retracement, we will pay attention to further testing the upper resistance area.
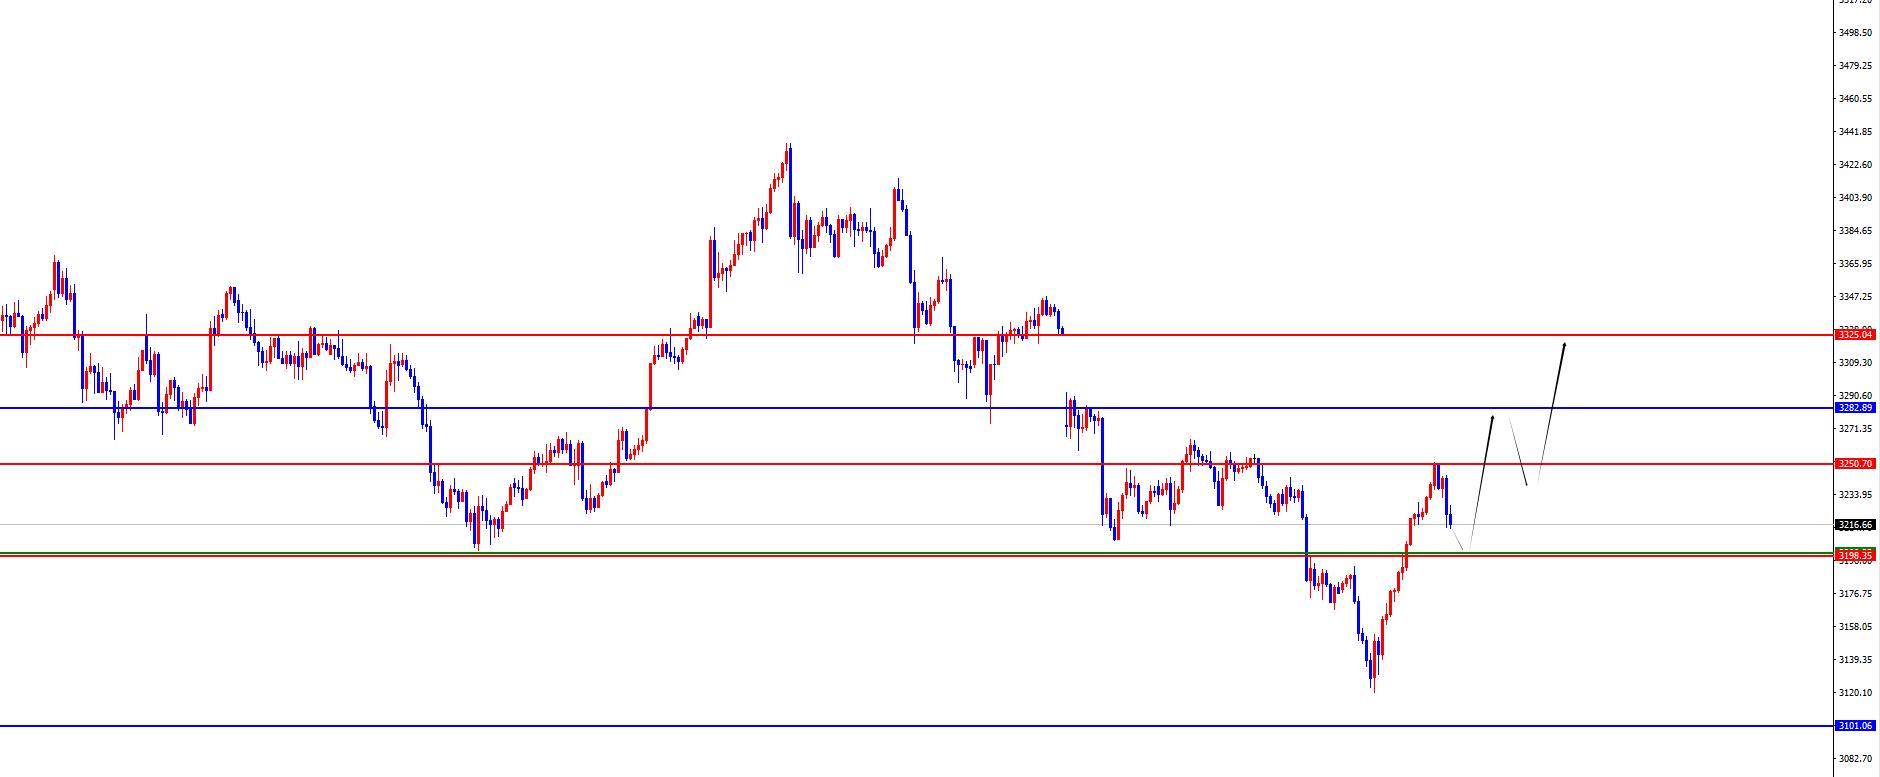
Gold has a long range of 3199-3200, with a defense of 10 US dollars, and a target of 3250-3282-3325
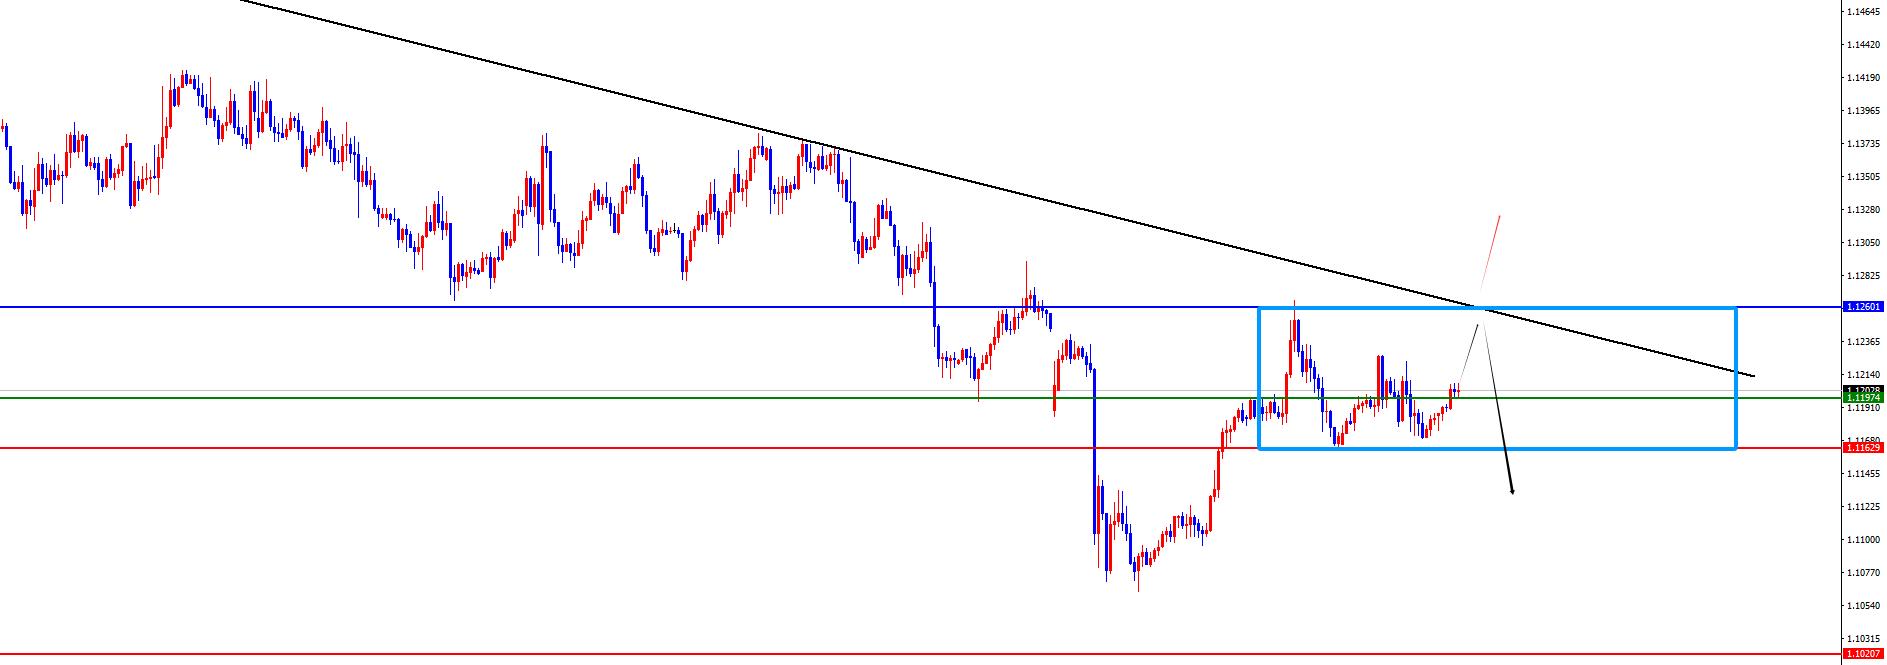
European and the United States
European and the United States, prices in Europe and the United States were generally on Thursday. The price fell to 1.1167 on the day and rose to 1.1227 on the spot and closed at 1.1183 on the spot. Looking back on the performance of European and American markets on Thursday, the morning opening price rebounded further in the short term based on four-hour support, but then under pressure to test the early low point. Although the daily line ended, it still depends on theThe old suppresses the daily resistance and leaves a long upper lead above. Therefore, the focus will be on the gains and losses of daily resistance in the future.
From a multi-cycle analysis, from the monthly level, Europe and the United States are supported by 1.0800, so long-term bulls are treated. From the weekly level, the price is supported by the 1.0960 area, and continues to be bullish from the perspective of the mid-line. The price decline is temporarily treated as a correction in the mid-line rise. From the daily level, the price breaks the daily support after the recent high fluctuation, and at the same time, the price continues to suppress the daily resistance after the breakdown. For short-term short-term treatment at 1.1250 on the band, it will only turn upward after the subsequent breakdown, otherwise it will be short-term treatment on the right. From the short-term four-hour level, European and American market prices have remained in a volatile pattern in recent days, and the long and short price have not continued. The lower support is in the 1.1160 area, and the upper resistance focuses on the daily resistance area. At the same time, according to the one-hour view, Europe and the United States are in short-term fluctuations, so it is currently divided into two ways to treat it. First, if the price does not break the daily resistance, first pay attention to the pressure, and once it breaks, it will be treated with the backhand. The second is to follow the layout after the price breaks through the range of 1.1160-1.1250.
Europe and the United States have a short range of 1.1250-60, defense is 50 points, target 1.1200-1.1160
[Finance data and events that are focused today] Friday, May 16, 2025
① To be determined, the Hang Seng Index eouu.cnpany announced the results of the series of reviews of the Hang Seng Index
②13:30 France's first quarter ILO unemployment rate
③17:00 Eurozone March seasonally adjusted trade account
④20:30 The total number of new houses in the United States in April was annualized
⑤ 20:30 Total number of construction permits in the United States in April
⑥20:30 Monthly rate of the United States import price index in April
⑦22:00 The expected initial value of the one-year inflation rate in May
⑧22:00 The initial value of the University of Michigan Consumer Confidence Index in May
⑨The next day 01:00 The total number of oil drilling rigs in the United States to May 16
Note: The above is only personal opinion and strategy, for reference and eouu.cnmunication only, and does not give customers any investment advice. It has nothing to do with customers' investment, and is not used as a basis for placing an order.
The above content is all about "[XM Foreign Exchange Decision Analysis]: Gold focuses on daily resistance and gap replenishment, and treats fluctuations in Europe and the United States". It is carefully eouu.cnpiled and edited by the editor of XM Foreign Exchange. I hope it will be helpful to your trading! Thanks for the support!
Only the strong know how to fight; the weak are not qualified to fail, but are born to be conquered. Step up to learn the next article!
Disclaimers: XM Group only provides execution services and access permissions for online trading platforms, and allows individuals to view and/or use the website or the content provided on the website, but has no intention of making any changes or extensions, nor will it change or extend its services and access permissions. All access and usage permissions will be subject to the following terms and conditions: (i) Terms and conditions; (ii) Risk warning; And (iii) a complete disclaimer. Please note that all information provided on the website is for general informational purposes only. In addition, the content of all XM online trading platforms does not constitute, and cannot be used for any unauthorized financial market trading invitations and/or invitations. Financial market transactions pose significant risks to your investment capital.
All materials published on online trading platforms are only intended for educational/informational purposes and do not include or should be considered for financial, investment tax, or trading related consulting and advice, or transaction price records, or any financial product or non invitation related trading offers or invitations.
All content provided by XM and third-party suppliers on this website, including opinions, news, research, analysis, prices, other information, and third-party website links, remains unchanged and is provided as general market commentary rather than investment advice. All materials published on online trading platforms are only for educational/informational purposes and do not include or should be considered as applicable to financial, investment tax, or trading related advice and recommendations, or transaction price records, or any financial product or non invitation related financial offers or invitations. Please ensure that you have read and fully understood the information on XM's non independent investment research tips and risk warnings. For more details, please click here